Night Sky Spectra - As seen by Mimir |
||
|
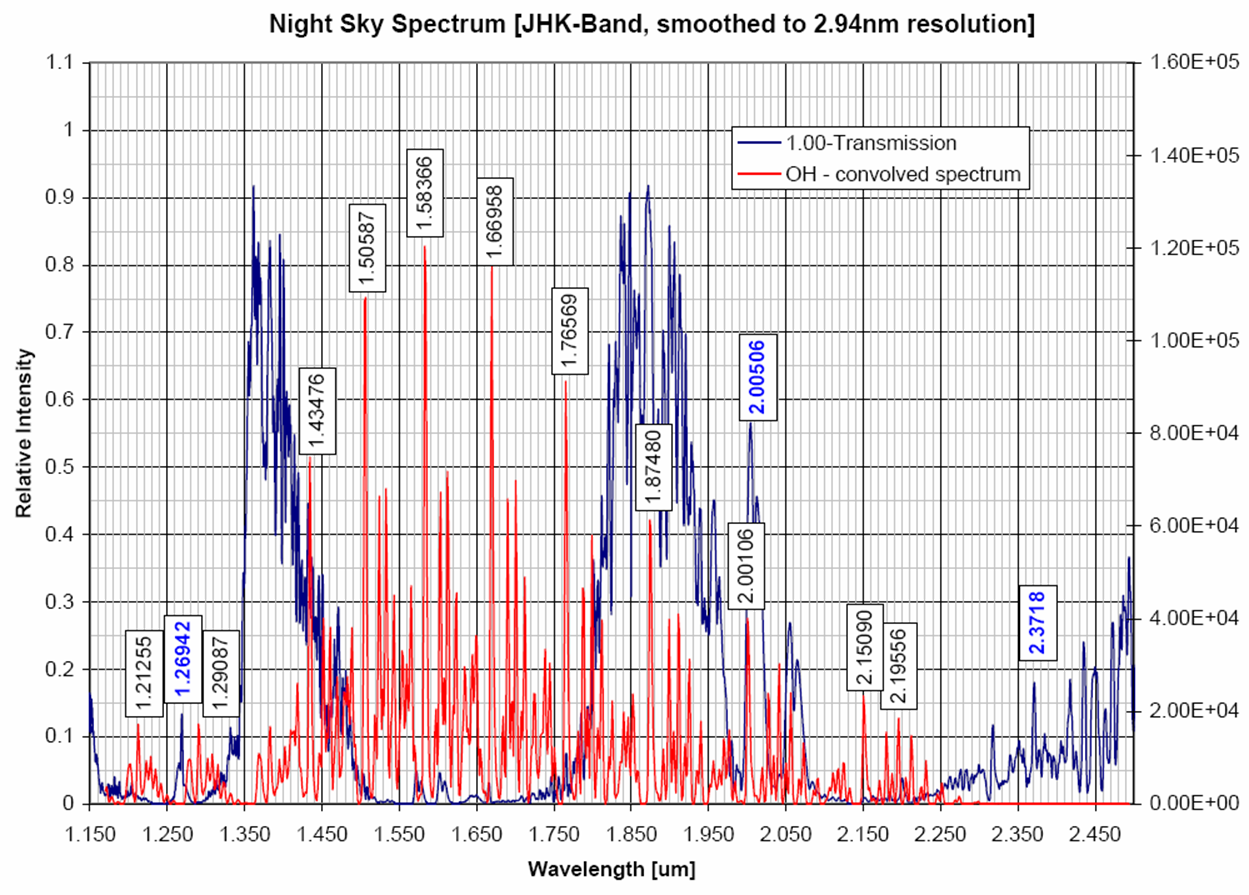
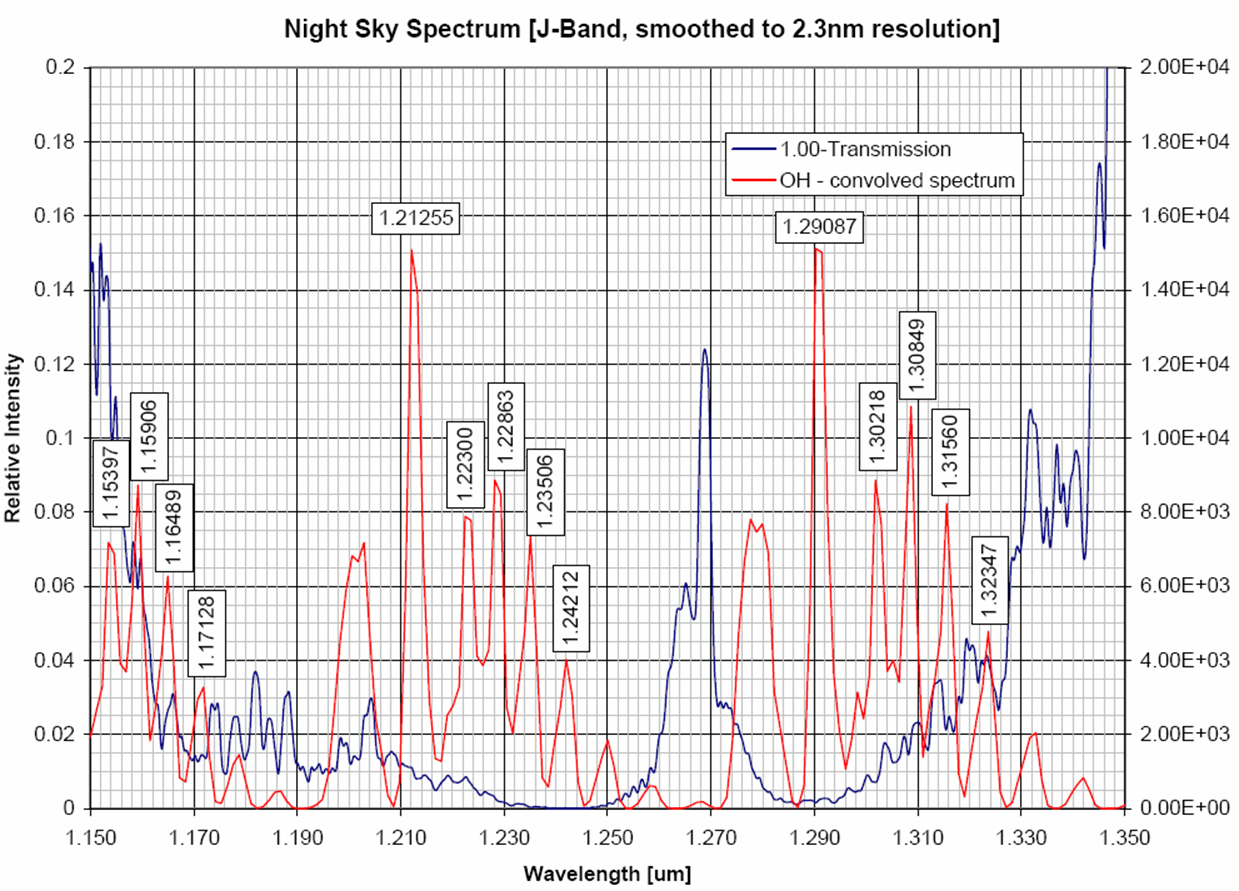
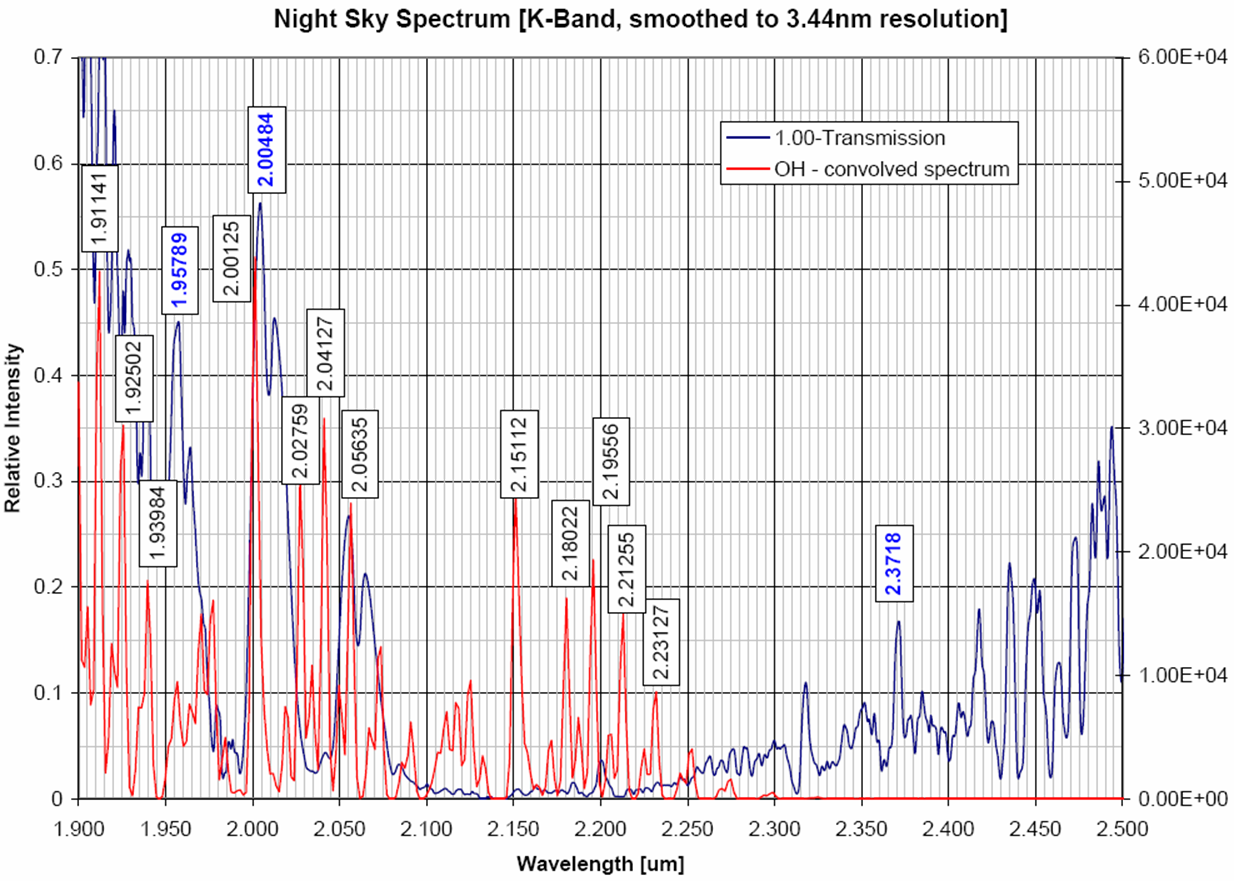
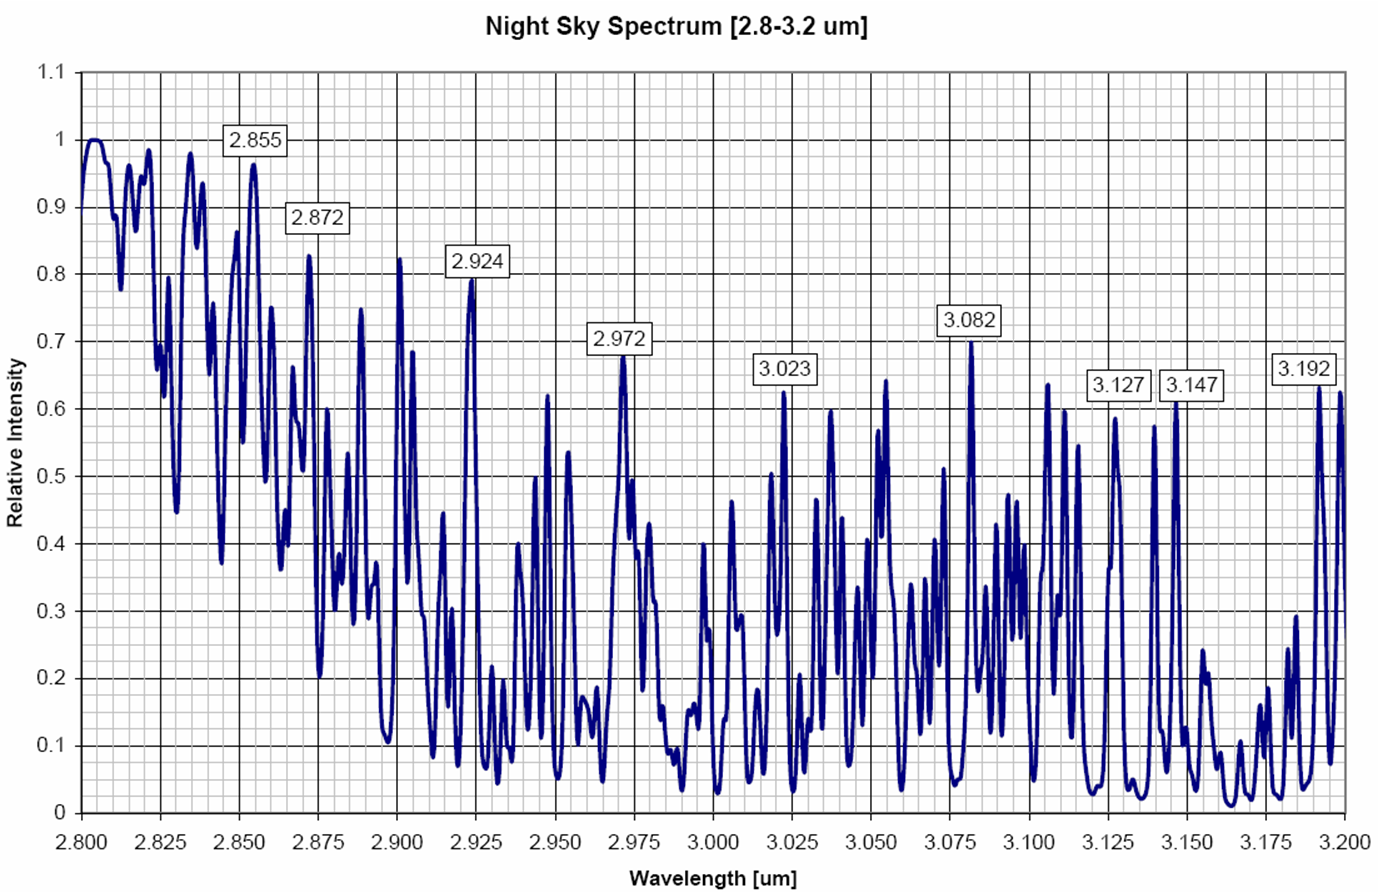
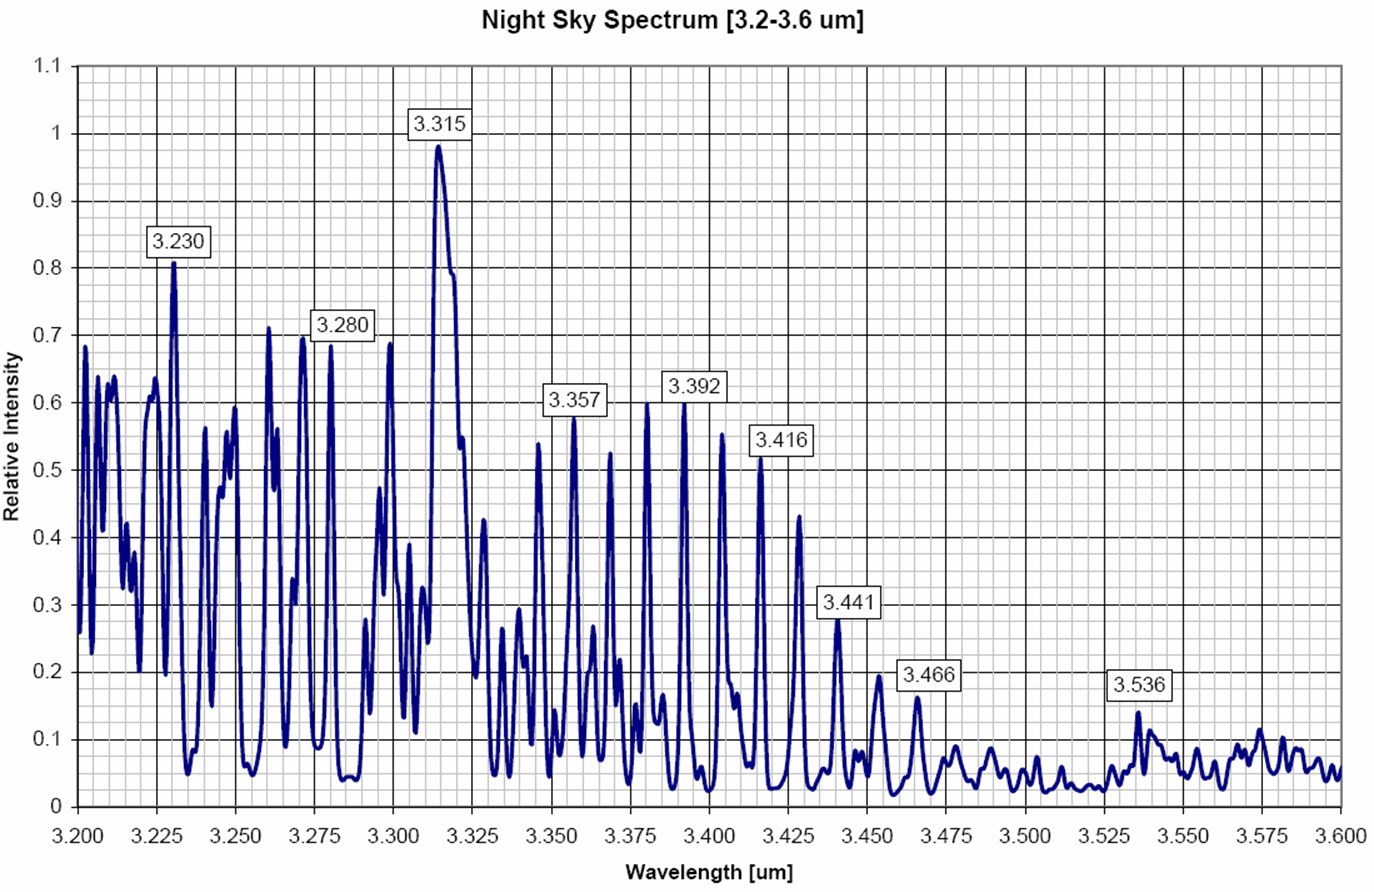
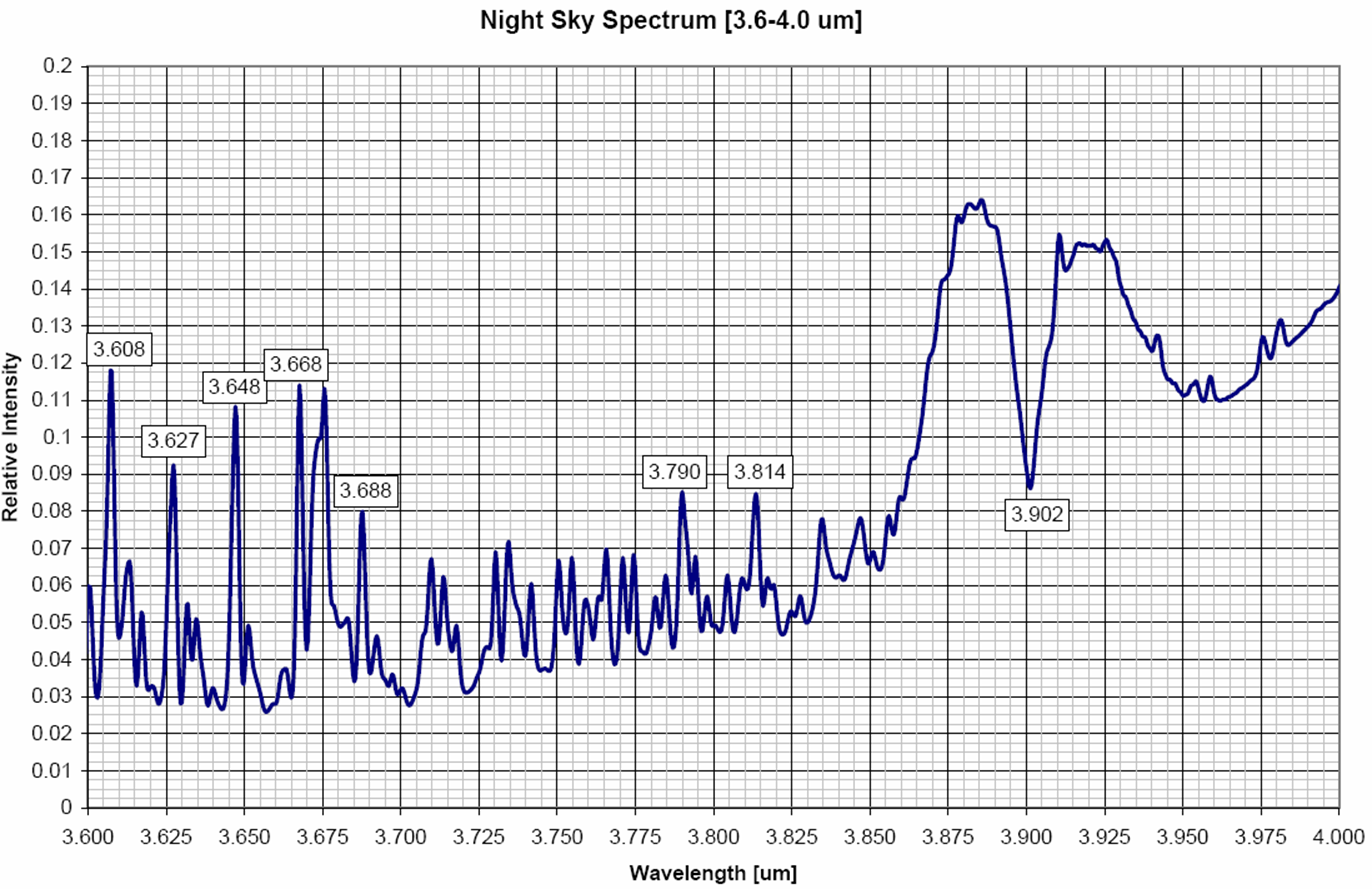
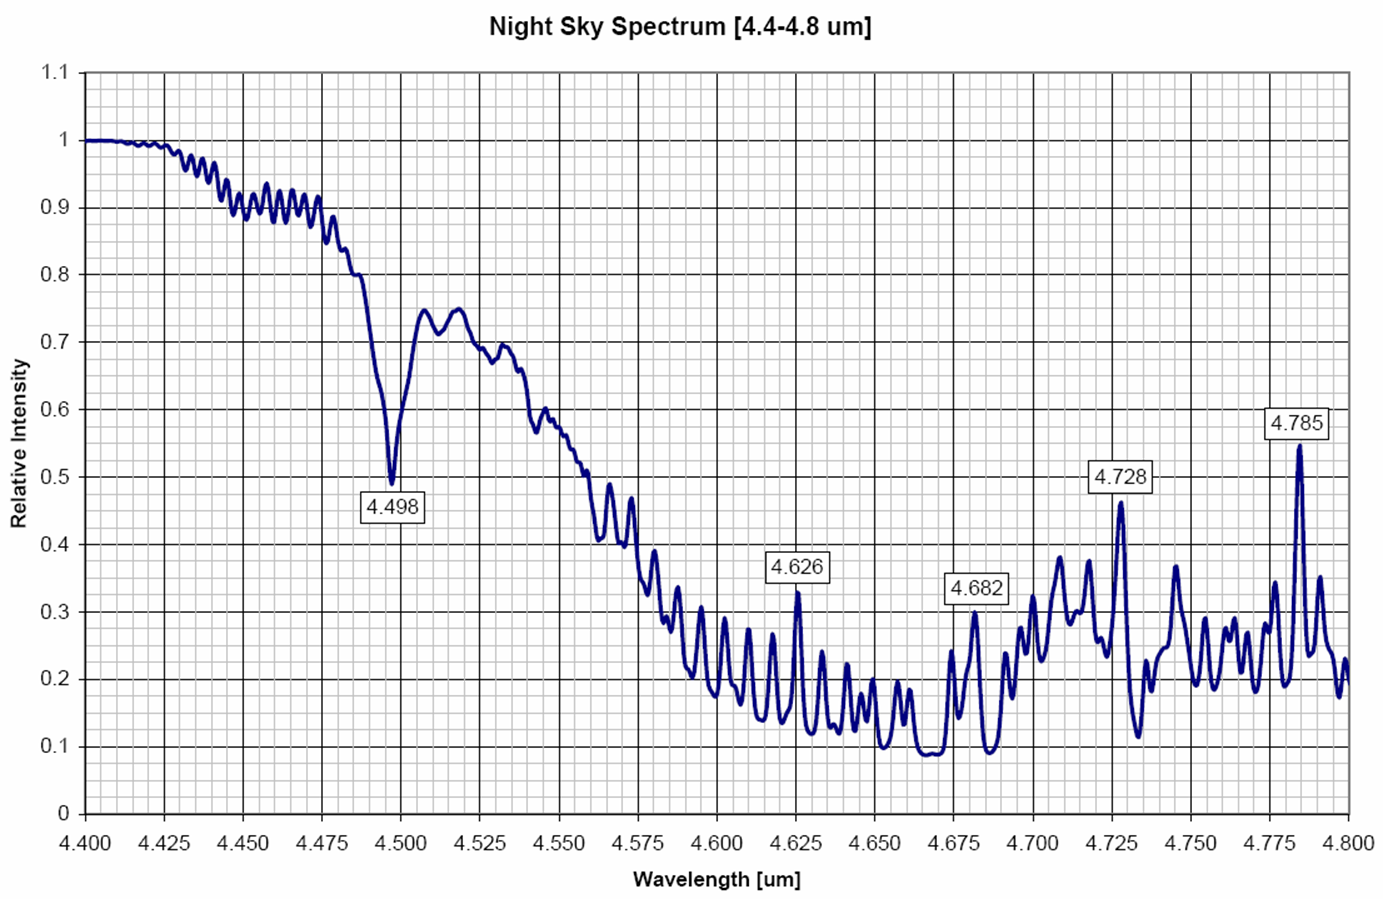
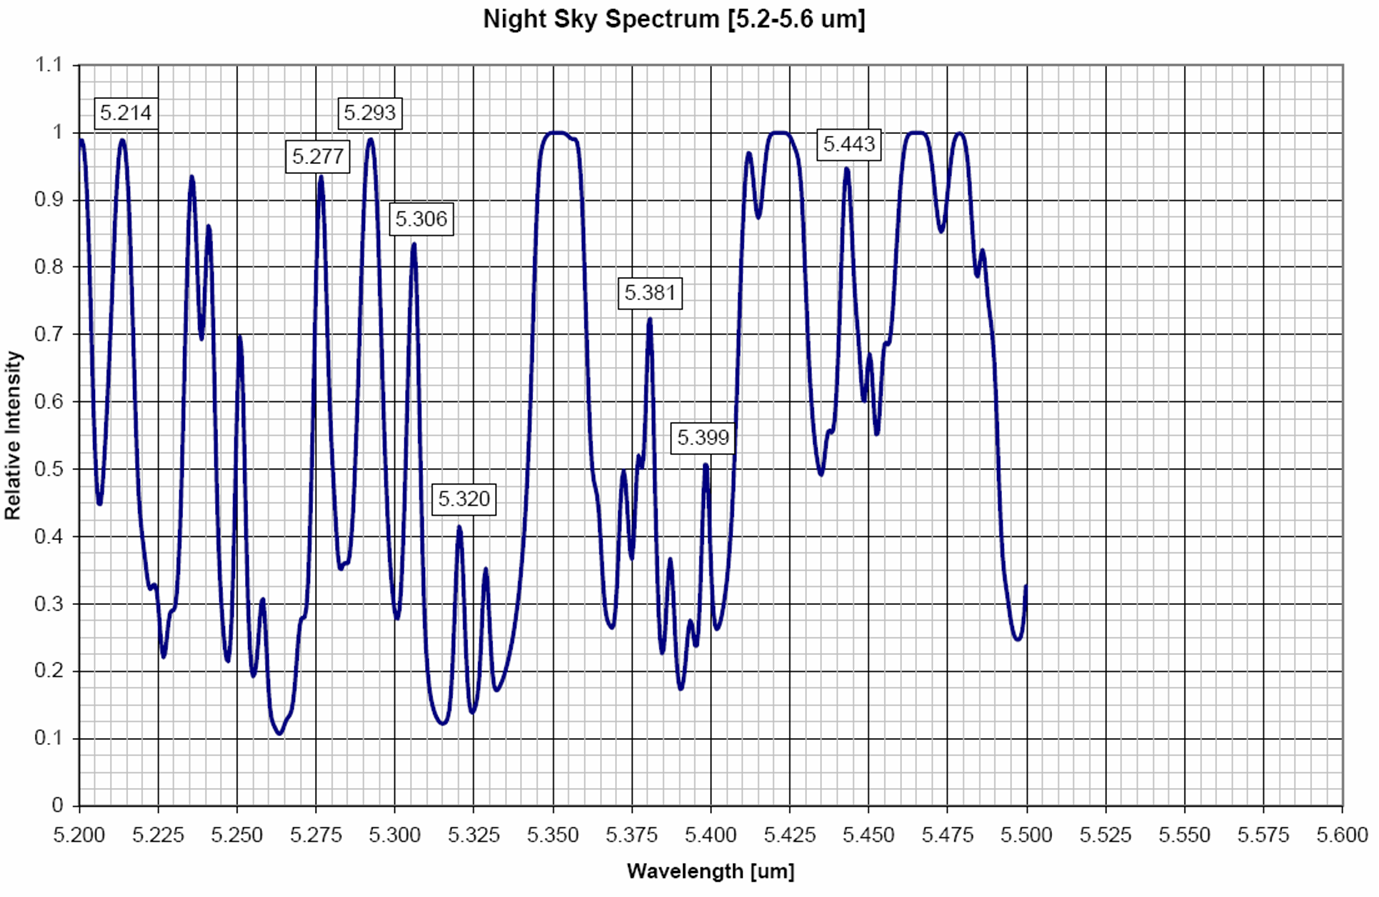
The following figures and tables attempt to model the spectra of the night sky as seen by Mimir in its most common spectroscopic configurations. The sky transmission data (blue lines on plots) is traceable back to Steve Lord's ATRAN program. The OH emission spectra were computed from model lines convolved and sampled with measured Mimir spectral resolutions using the sp_generate_model_OH_line_spectrum.pro IDL code I wrote (click the link to see another web page describing the use of this program and the source code). I have labelled the central wavelengths of features in the model OH spectra, based on gaussian fits of the cores of the model features. I have also labelled key atmospheric transmission spectral features that may be useful for wavelength calibration (especially true at LM wavelengths). Note that the blue "transmission" curves are really the transmission subtracted from unity, which gives a scaled version of sky thermal emission features produced by species other than OH. The following table allows selection of full-sized PNG or PDF images or (for the JHK wavelengths) the OH convolved, resampled model spectra. DPC 20060304
|
||||||||||||||||||||||||||||||||||||||||||||||||