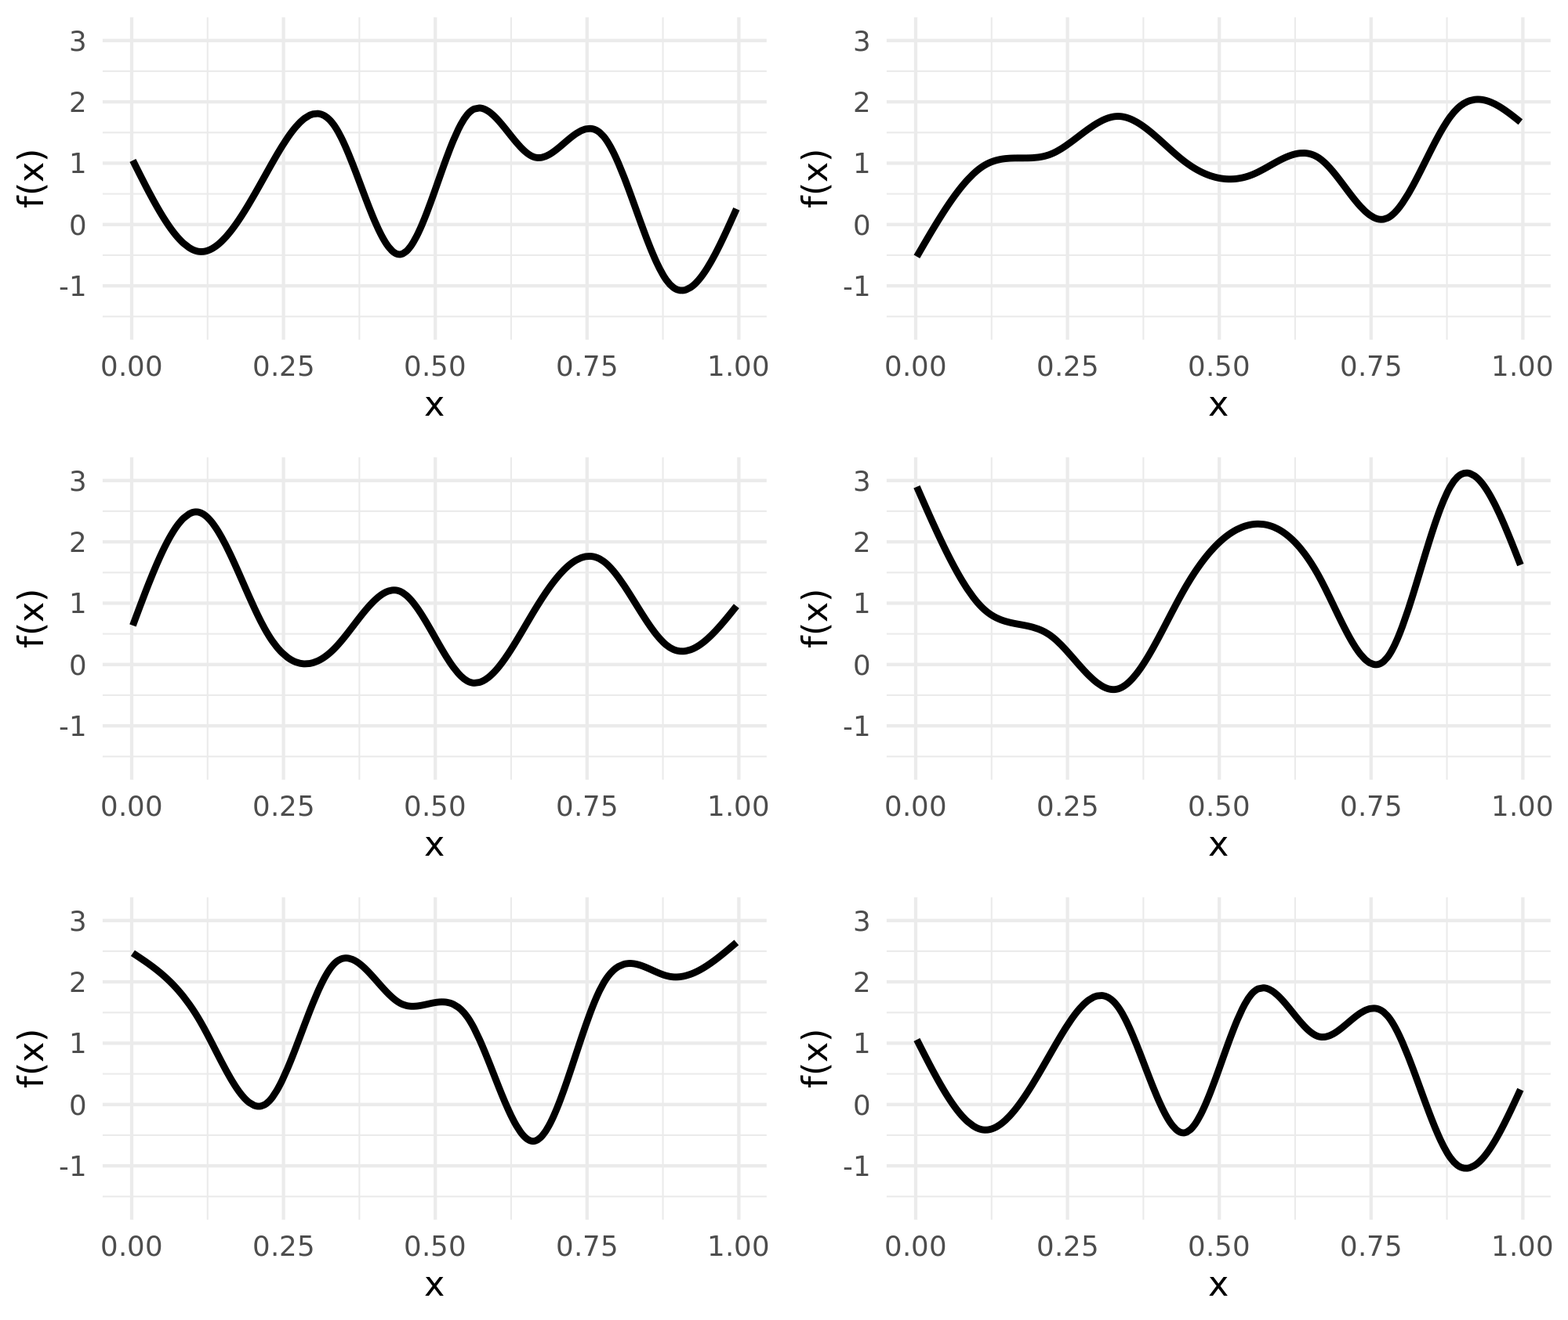
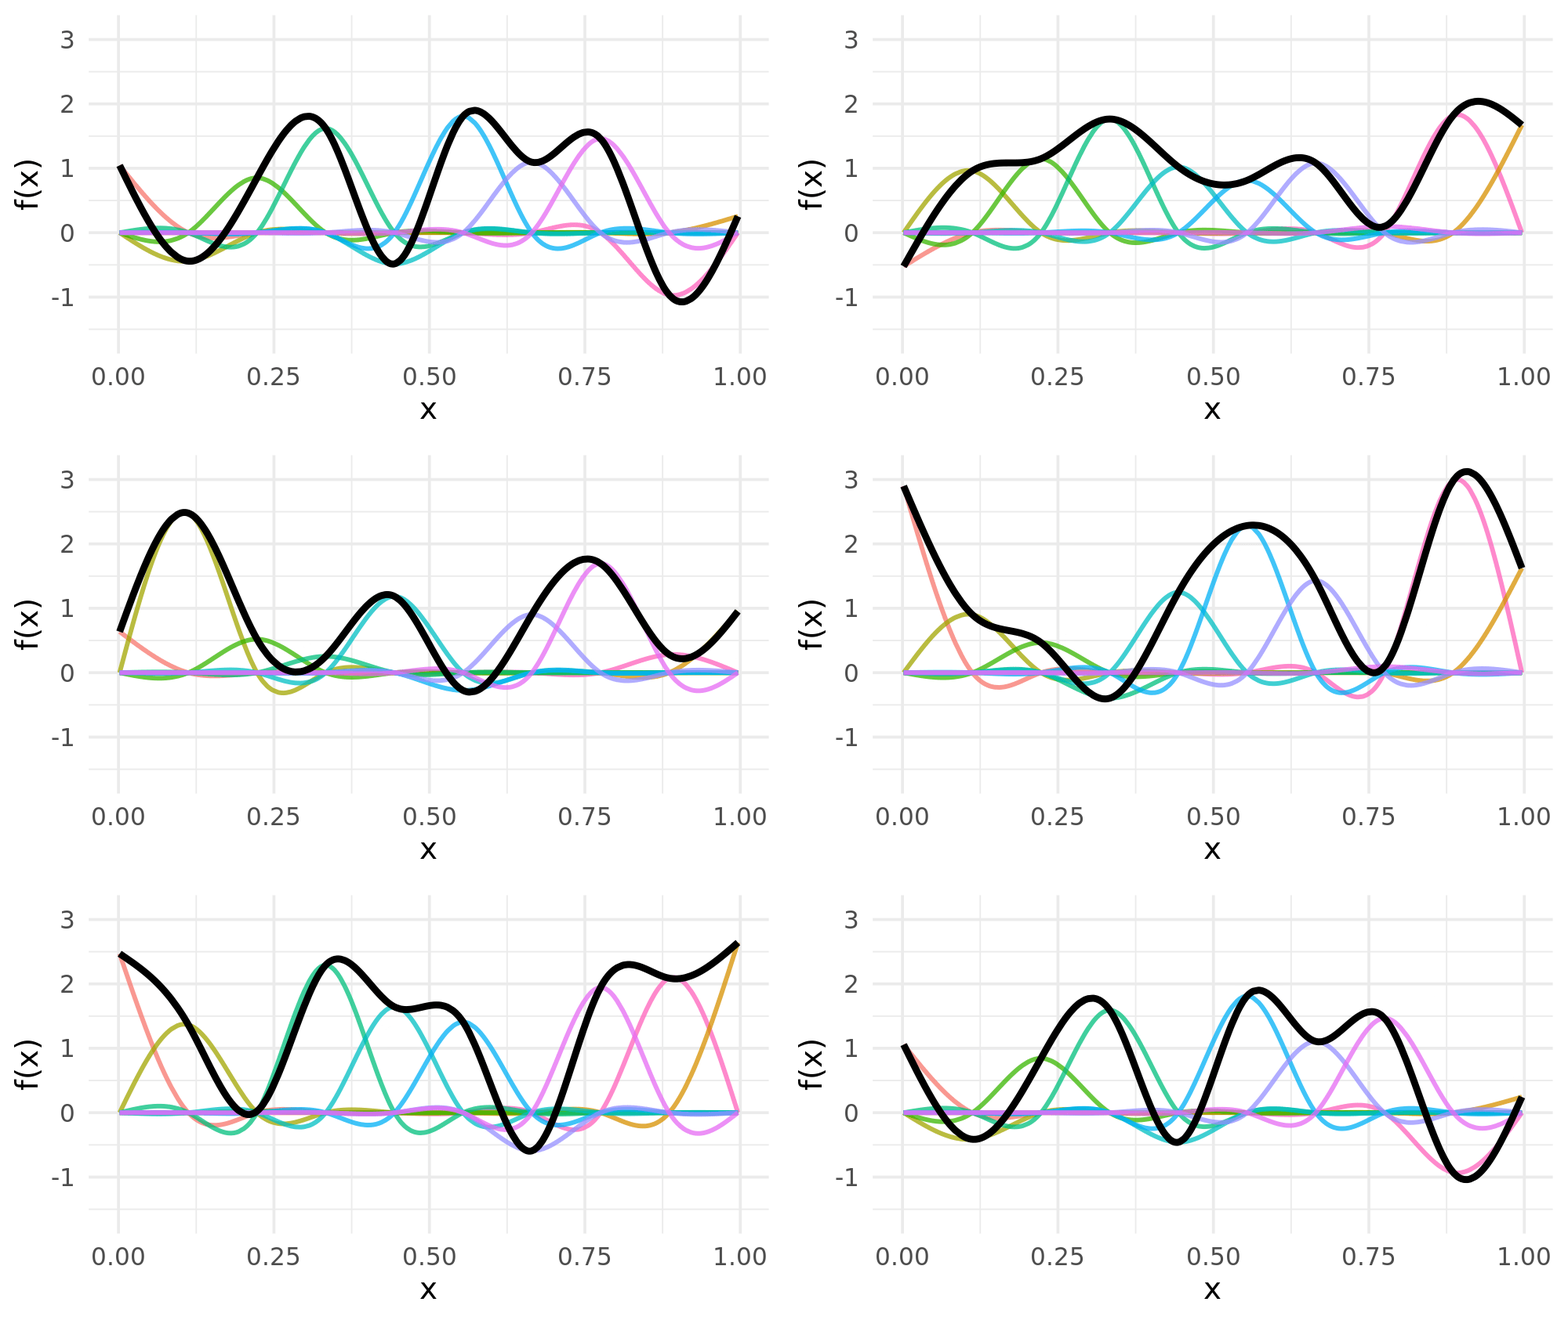
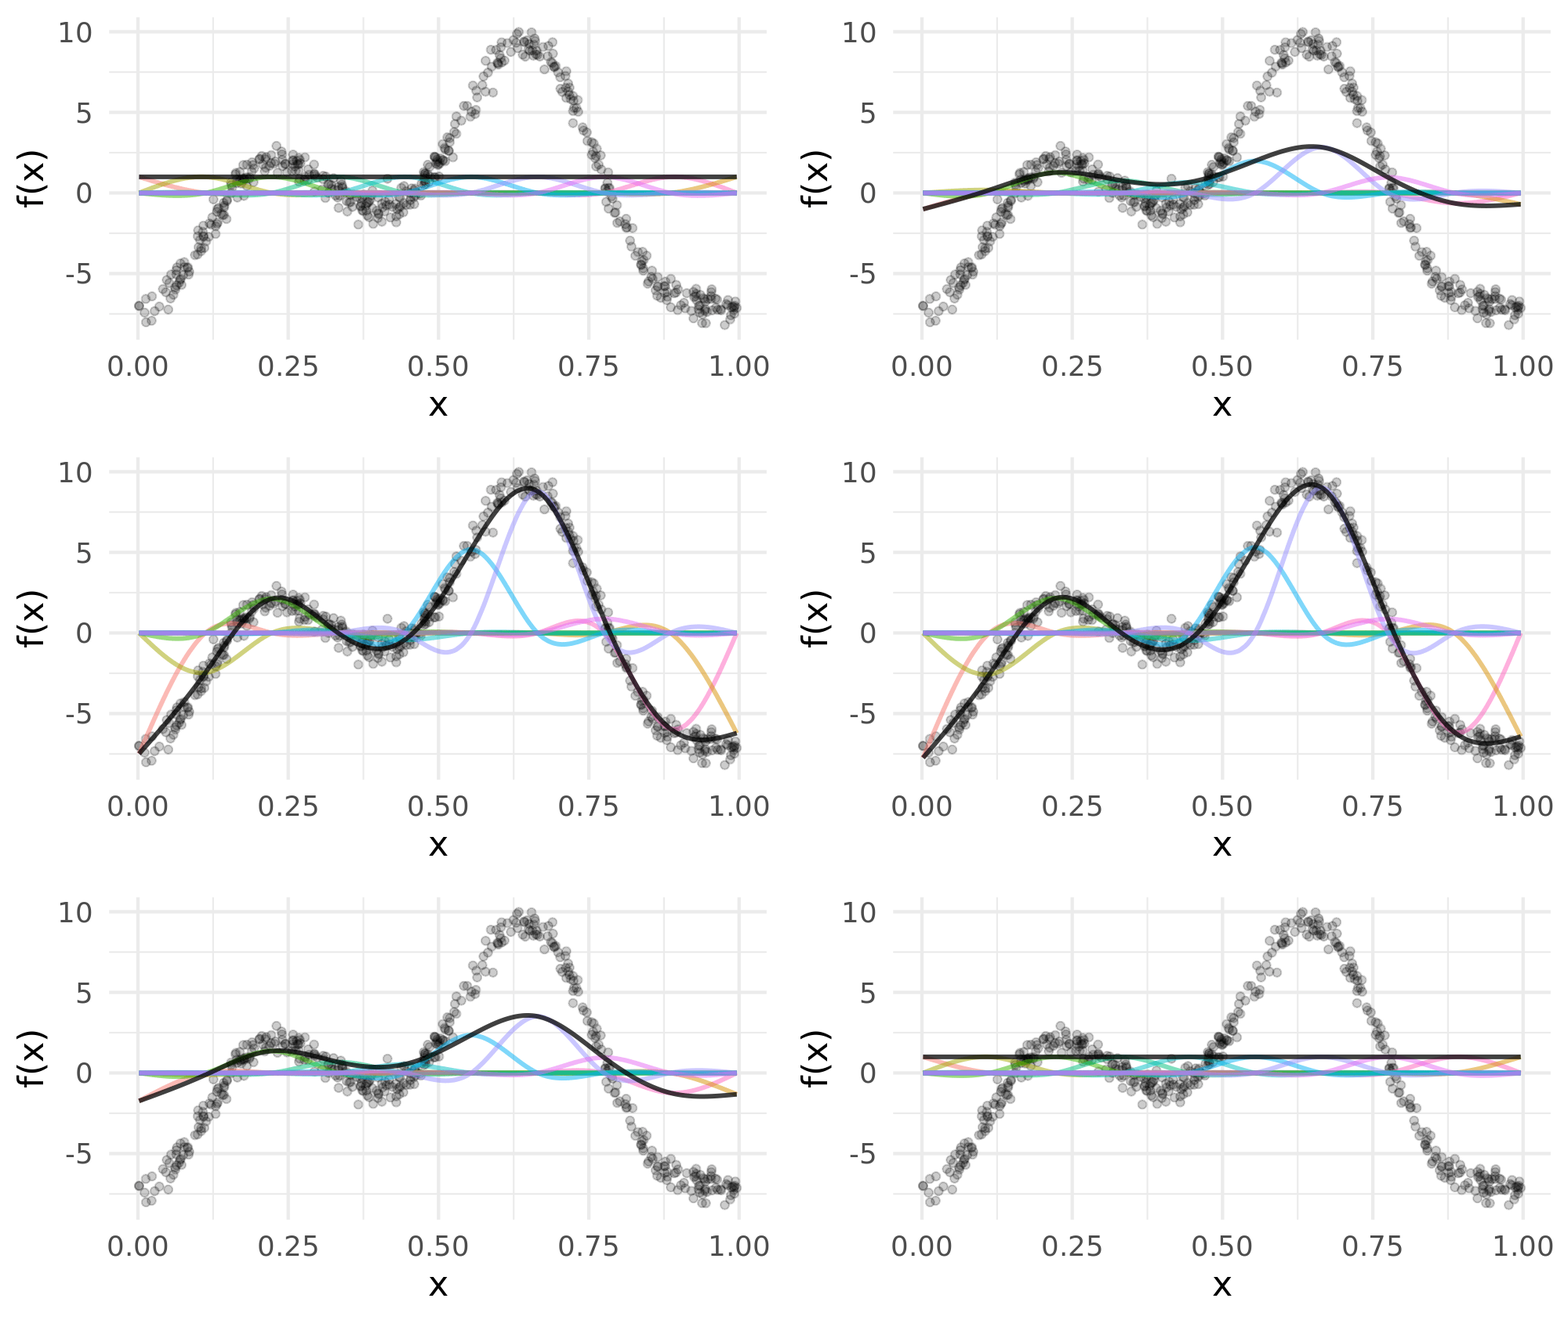
class: inverse, middle, left, my-title-slide, title-slide # Generalized Additive Models with R and mgcv ### Slides borrowed heavily from Gavin Simpson --- # Today's topics * What are GAMs? * How to fit GAMs in R with **mgcv** * Examples * Simpson's original HTML Slide deck [bit.ly/gam-efi-22]() © Simpson (2022) [](http://creativecommons.org/licenses/by/4.0/) * RMarkdown [bit.ly/gam-efi-git](https://bit.ly/gam-efi-git) --- # Example: HadCRUT4 time series <!-- --> ??? Hadley Centre NH temperature record ensemble How would you model the trend in these data? --- # Linear Models `$$y_i \sim \mathcal{N}(\mu_i, \sigma^2)$$` `$$\mu_i = \beta_0 + \beta_1 x_{1i} + \beta_2 x_{2i} + \cdots + \beta_j x_{ji}$$` Assumptions 1. linear effects of covariates are good approximation of the true effects 2. conditional on the values of covariates, `\(y_i | \mathbf{X} \sim \mathcal{N}(0, \sigma^2)\)` 3. this implies all observations have the same *variance* 4. `\(y_i | \mathbf{X}\)` are *independent* An **additive** model address the first of these --- class: inverse center middle subsection # Why bother with anything more complex? --- # Is this linear? <!-- --> --- # Polynomials perhaps… <!-- --> --- # Polynomials perhaps… We can keep on adding ever more powers of `\(\boldsymbol{x}\)` to the model — model selection problem **Runge phenomenon** — oscillations at the edges of an interval — means simply moving to higher-order polynomials doesn't always improve accuracy --- class: inverse middle center subsection # GAMs offer a solution --- # HadCRUT data set [File format](https://www.metoffice.gov.uk/hadobs/hadcrut4/data/current/series_format.html) ```r gtemp ``` ``` ## # A tibble: 172 × 2 ## Year Temperature ## <dbl> <dbl> ## 1 1850 -0.336 ## 2 1851 -0.159 ## 3 1852 -0.107 ## 4 1853 -0.177 ## 5 1854 -0.071 ## 6 1855 -0.19 ## 7 1856 -0.378 ## 8 1857 -0.405 ## 9 1858 -0.4 ## 10 1859 -0.215 ## # … with 162 more rows ``` --- # Fitting a GAM ```r library('mgcv') m <- gam(Temperature ~ s(Year), data = gtemp, method = 'REML') summary(m) ``` .smaller[ ``` ## ## Family: gaussian ## Link function: identity ## ## Formula: ## Temperature ~ s(Year) ## ## Parametric coefficients: ## Estimate Std. Error t value Pr(>|t|) ## (Intercept) -0.020477 0.009731 -2.104 0.0369 * ## --- ## Signif. codes: 0 '***' 0.001 '**' 0.01 '*' 0.05 '.' 0.1 ' ' 1 ## ## Approximate significance of smooth terms: ## edf Ref.df F p-value ## s(Year) 7.837 8.65 145.1 <2e-16 *** ## --- ## Signif. codes: 0 '***' 0.001 '**' 0.01 '*' 0.05 '.' 0.1 ' ' 1 ## ## R-sq.(adj) = 0.88 Deviance explained = 88.6% ## -REML = -91.237 Scale est. = 0.016287 n = 172 ``` ] --- # Fitted GAM <!-- --> --- class: inverse middle center big-subsection # GAMs --- # Generalized Additive Models <br />  .references[Source: [GAMs in R by Noam Ross](https://noamross.github.io/gams-in-r-course/)] ??? GAMs are an intermediate-complexity model * can learn from data without needing to be informed by the user * remain interpretable because we can visualize the fitted features --- # How is a GAM different? In LM we model the mean of data as a sum of linear terms: `$$y_i = \beta_0 +\sum_j \color{red}{ \beta_j x_{ji}} +\epsilon_i$$` A GAM is a sum of _smooth functions_ or _smooths_ `$$y_i = \beta_0 + \sum_j \color{red}{s_j(x_{ji})} + \epsilon_i$$` where `\(\epsilon_i \sim N(0, \sigma^2)\)`, `\(y_i \sim \text{Normal}\)` (for now) Call the above equation the **linear predictor** in both cases --- # Fitting a GAM in R ```r model <- gam(y ~ s(x1) + s(x2) + te(x3, x4), # formuala describing model data = my_data_frame, # your data method = 'REML', # or 'ML' family = gaussian) # or something more exotic ``` `s()` terms are smooths of one or more variables `te()` terms are the smooth equivalent of *main effects + interactions* --- # How did `gam()` *know*? <!-- --> --- # Wiggly things .center[] ??? GAMs use splines to represent the non-linear relationships between covariates, here `x`, and the response variable on the `y` axis. --- # Basis expansions In the polynomial models we used a polynomial basis expansion of `\(\boldsymbol{x}\)` * `\(\boldsymbol{x}^0 = \boldsymbol{1}\)` — the model constant term * `\(\boldsymbol{x}^1 = \boldsymbol{x}\)` — linear term * `\(\boldsymbol{x}^2\)` * `\(\boldsymbol{x}^3\)` * … --- # Splines Splines are *functions* composed of simpler functions Simpler functions are *basis functions* & the set of basis functions is a *basis* When we model using splines, each basis function `\(b_k\)` has a coefficient `\(\beta_k\)` Resultant spline is a the sum of these weighted basis functions, evaluated at the values of `\(x\)` `$$s(x) = \sum_{k = 1}^K \beta_k b_k(x)$$` --- # Splines formed from basis functions <!-- --> ??? Splines are built up from basis functions Here I'm showing a cubic regression spline basis with 10 knots/functions We weight each basis function to get a spline. Here all the basisi functions have the same weight so they would fit a horizontal line --- # Weight basis functions ⇨ spline .center[] ??? But if we choose different weights we get more wiggly spline Each of the splines I showed you earlier are all generated from the same basis functions but using different weights --- # Key features of GAMs `$$s(x) = \sum_{k = 1}^K \beta_k b_k(x)$$` * basis functions can be precomputed, becomes another X * basis functions are centered on a set of prespecified *knots*, usually evenly spaced * default number is K=10, nothing special about this choice (model selection) * gam returns edf (effective degrees of freedom), if close to K may need more knots --- # How do GAMs learn from data? <!-- --> ??? How does this help us learn from data? Here I'm showing a simulated data set, where the data are drawn from the orange functions, with noise. We want to learn the orange function from the data --- # Maximise penalised log-likelihood ⇨ β .center[] ??? Fitting a GAM involves finding the weights for the basis functions that produce a spline that fits the data best, subject to some constraints --- class: inverse middle center subsection # Avoid overfitting our sample --- class: inverse center middle large-subsection # How wiggly? $$ \int_{\mathbb{R}} [f^{\prime\prime}]^2 dx = \boldsymbol{\beta}^{\mathsf{T}}\mathbf{S}\boldsymbol{\beta} $$ --- class: inverse center middle large-subsection # Penalised fit $$ \mathcal{L}_p(\boldsymbol{\beta}) = \mathcal{L}(\boldsymbol{\beta}) - \frac{1}{2} \lambda\boldsymbol{\beta}^{\mathsf{T}}\mathbf{S}\boldsymbol{\beta} $$ --- # Wiggliness `$$\int_{\mathbb{R}} [f^{\prime\prime}]^2 dx = \boldsymbol{\beta}^{\mathsf{T}}\mathbf{S}\boldsymbol{\beta} = \large{W}$$` (Wiggliness is 100% the right mathy word) We penalize wiggliness to avoid overfitting --- # Making wiggliness matter `\(W\)` measures **wiggliness** (log) likelihood measures closeness to the data We use a **smoothing parameter** `\(\lambda\)` to define the trade-off, to find the spline coefficients `\(B_k\)` that maximize the **penalized** log-likelihood `$$\mathcal{L}_p = \log(\text{Likelihood}) - \lambda W$$` --- # HadCRUT4 time series <!-- --> --- # Picking the right wiggliness .pull-left[ Two ways to think about how to optimize `\(\lambda\)`: * Predictive: Minimize out-of-sample error * Bayesian: Put priors on our basis coefficients ] .pull-right[ Many methods: AIC, Mallow's `\(C_p\)`, GCV, ML, REML * **Practically**, use **REML**, because of numerical stability * Hence `gam(..., method = "REML")` ] .center[  ] --- # Maximum allowed wiggliness We set **basis complexity** or "size" `\(k\)` This is _maximum wigglyness_, can be thought of as number of small functions that make up a curve Once smoothing is applied, curves have fewer **effective degrees of freedom (EDF)** EDF < `\(k\)` --- # Maximum allowed wiggliness `\(k\)` must be *large enough*, the `\(\lambda\)` penalty does the rest *Large enough* — space of functions representable by the basis includes the true function or a close approximation to the tru function Bigger `\(k\)` increases computational cost In **mgcv**, default `\(k\)` values are arbitrary — after choosing the model terms, this is the key user choice **Must be checked!** — `gam.check()` --- # GAM summary so far 1. GAMs give us a framework to model flexible nonlinear relationships 2. Use little functions (**basis functions**) to make big functions (**smooths**) 3. Use a **penalty** to trade off wiggliness/generality 4. Need to make sure your smooths are **wiggly enough** --- class: inverse middle center subsection # A cornucopia of smooths --- # A cornucopia of smooths The type of smoother is controlled by the `bs` argument (think *basis*) The default is a low-rank thin plate spline `bs = 'tp'` Many others available .row[ .col-6[ * Cubic splines `bs = 'cr'` * P splines `bs = 'ps'` * Cyclic splines `bs = 'cc'` or `bs = 'cp'` * Adaptive splines `bs = 'ad'` * Random effect `bs = 're'` * Factor smooths `bs = 'fs'` ] .col-6[ * Duchon splines `bs = 'ds'` * Spline on the sphere `bs = 'sos'` * MRFs `bs = 'mrf'` * Soap-film smooth `bs = 'so'` * Gaussian process `bs = 'gp'` ] ] --- # A bestiary of conditional distributions A GAM is just a fancy GLM Simon Wood & colleagues (2016) have extended the *mgcv* methods to some non-exponential family distributions .row[ .col-6[ * `binomial()` * `poisson()` * `Gamma()` * `inverse.gaussian()` * `nb()` * `tw()` * `mvn()` * `multinom()` ] .col-6[ * `betar()` * `scat()` * `gaulss()` * `ziplss()` * `twlss()` * `cox.ph()` * `gamals()` * `ocat()` ] ] --- # Bayesian GAMs ```r m <- jagam(Temperature ~ s(Year), data = gtemp, file = "HadGAM.txt") names(m) ``` ``` ## [1] "pregam" "jags.data" "jags.ini" ``` ```r HadGAM <- readLines("HadGAM.txt") HadGAM ``` ``` ## [1] "model {" ## [2] " mu <- X %*% b ## expected response" ## [3] " for (i in 1:n) { y[i] ~ dnorm(mu[i],tau) } ## response " ## [4] " scale <- 1/tau ## convert tau to standard GLM scale" ## [5] " tau ~ dgamma(.05,.005) ## precision parameter prior " ## [6] " ## Parametric effect priors CHECK tau=1/0.36^2 is appropriate!" ## [7] " for (i in 1:1) { b[i] ~ dnorm(0,7.9) }" ## [8] " ## prior for s(Year)... " ## [9] " K1 <- S1[1:9,1:9] * lambda[1] + S1[1:9,10:18] * lambda[2]" ## [10] " b[2:10] ~ dmnorm(zero[2:10],K1) " ## [11] " ## smoothing parameter priors CHECK..." ## [12] " for (i in 1:2) {" ## [13] " lambda[i] ~ dgamma(.05,.005)" ## [14] " rho[i] <- log(lambda[i])" ## [15] " }" ## [16] "}" ``` --- ```r # Bayesian GAMs library(rjags) j.model <- jags.model (file = textConnection(HadGAM), data = m$jags.data, inits = m$jags.ini, n.chains = 3) ``` ``` ## Compiling model graph ## Resolving undeclared variables ## Allocating nodes ## Graph information: ## Observed stochastic nodes: 172 ## Unobserved stochastic nodes: 5 ## Total graph size: 2263 ## ## Initializing model ``` ```r jags.out <- coda.samples(model = j.model, variable.names = c("b","tau","lambda"), n.iter = 5000) plot(jags.out) ``` <!-- --><!-- --><!-- --><!-- --> --- ```r beta <- out[,grep("^b",colnames(out))] for(i in 1:nrow(out)){ yconf[i,] = m$jags.data$X %*% beta[i,] ypred[i,] = rnorm(npred,yconf[i,],1/sqrt(out[i,"tau"])) } ``` <!-- --> --- # Smooth interactions Two ways to fit smooth interactions 1. Bivariate (or higher order) thin plate splines * `s(x, z, bs = 'tp')` * Isotropic; single smoothness parameter for the smooth * Sensitive to scales of `x` and `z` 2. Tensor product smooths * Separate marginal basis for each smooth, separate smoothness parameters * Invariant to scales of `x` and `z` * Use for interactions when variables are in different units * `te(x, z)` --- # Tensor product smooths There are multiple ways to build tensor products in *mgcv* 1. `te(x, z)` 2. `t2(x, z)` 3. `s(x) + s(z) + ti(x, z)` `te()` is the most general form but not usable in `gamm4::gamm4()` or *brms* `t2()` is an alternative implementation that does work in `gamm4::gamm4()` or *brms* `ti()` fits pure smooth interactions; where the main effects of `x` and `z` have been removed from the basis --- # Factor smooth interactions Two ways for factor smooth interactions 1. `by` variable smooths * entirely separate smooth function for each level of the factor * each has it's own smoothness parameter * centred (no group means) so include factor as a fixed effect * `y ~ f + s(x, by = f)` 2. `bs = 'fs'` basis * smooth function for each level of the function * share a common smoothness parameter * fully penalized; include group means * closer to random effects * `y ~ s(x, f, bs = 'fs')` --- # Random effects When fitted with REML or ML, smooths can be viewed as just fancy random effects Inverse is true too; random effects can be viewed as smooths If you have simple random effects you can fit those in `gam()` and `bam()` without needing the more complex GAMM functions `gamm()` or `gamm4::gamm4()` These two models are equivalent ```r m_nlme <- lme(travel ~ 1, data = Rail, ~ 1 | Rail, method = "REML") m_gam <- gam(travel ~ s(Rail, bs = "re"), data = Rail, method = "REML") ``` --- # Random effects The random effect basis `bs = 're'` is not as computationally efficient as *nlme* or *lme4* for fitting * complex random effects terms, or * random effects with many levels Instead see `gamm()` and `gamm4::gamm4()` * `gamm()` fits using `lme()` * `gamm4::gamm4()` fits using `lmer()` or `glmer()` For non Gaussian models use `gamm4::gamm4()` --- # Next steps Read Simon Wood's book! Lots more material on ESA GAM Workshop site [https://noamross.github.io/mgcv-esa-workshop/]() Noam Ross' free GAM Course <https://noamross.github.io/gams-in-r-course/> A couple of papers: .smaller[ 1. Simpson, G.L., 2018. Modelling Palaeoecological Time Series Using Generalised Additive Models. Frontiers in Ecology and Evolution 6, 149. https://doi.org/10.3389/fevo.2018.00149 2. Pedersen, E.J., Miller, D.L., Simpson, G.L., Ross, N., 2019. Hierarchical generalized additive models in ecology: an introduction with mgcv. PeerJ 7, e6876. https://doi.org/10.7717/peerj.6876 ] Also see Gavin's blog: [www.fromthebottomoftheheap.net](http://www.fromthebottomoftheheap.net)