|
Filter
Common Name |
Barr
Lot, Filter Name |
Bandpass
Plot |
Barr
Bandpass Data |
Mimir
Bandpass Data* |
|
J |
MAN236- |
|
|
|
|
H |
MAN102- |
|
|
|
K |
MAN301- |
|
|
|
L |
MAN402A- |
|
|
|
M |
MAN502- |
|
|
|
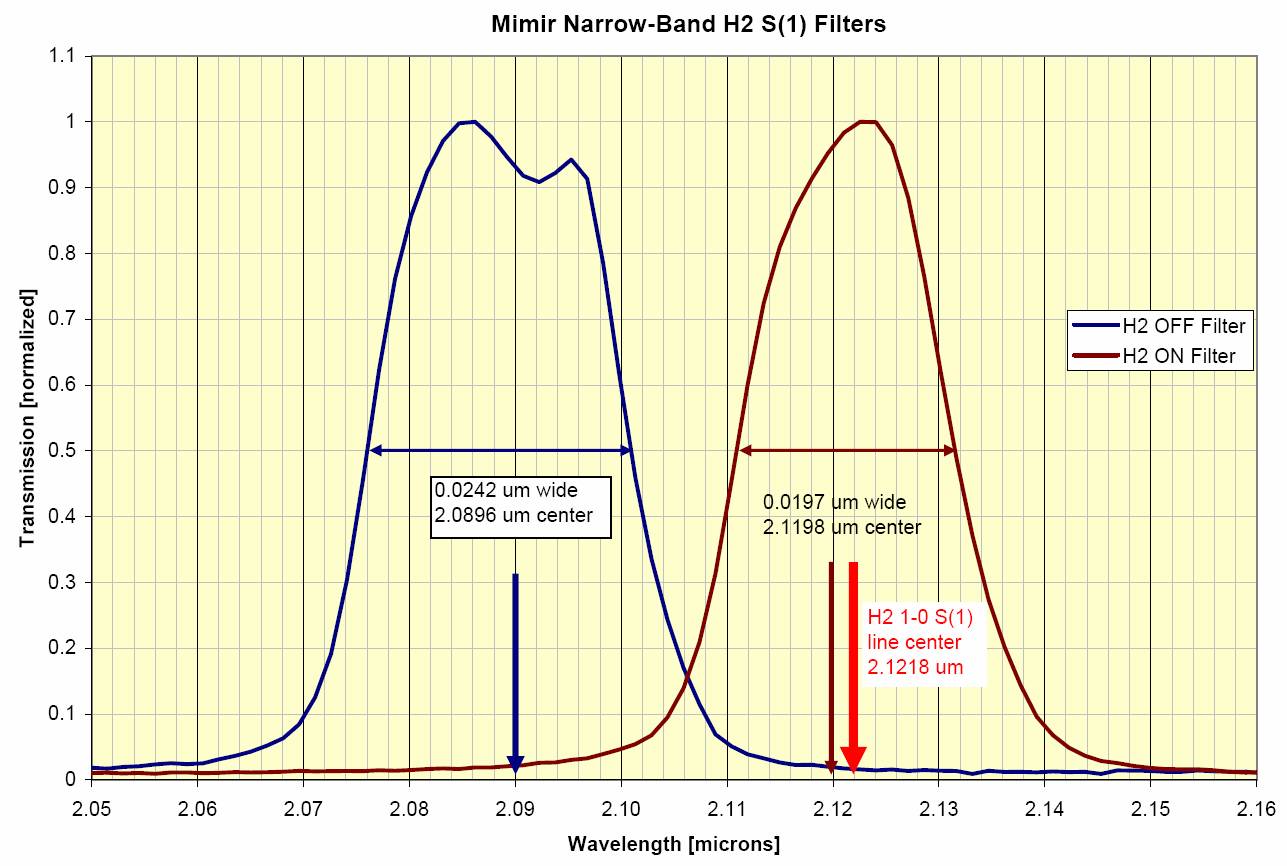
H2-On |
|
|
|
|
|
H2-Off |
|
Barr_H2-Off.dat |
|
PK50 |
2.8mm
Thick |
|
|
|
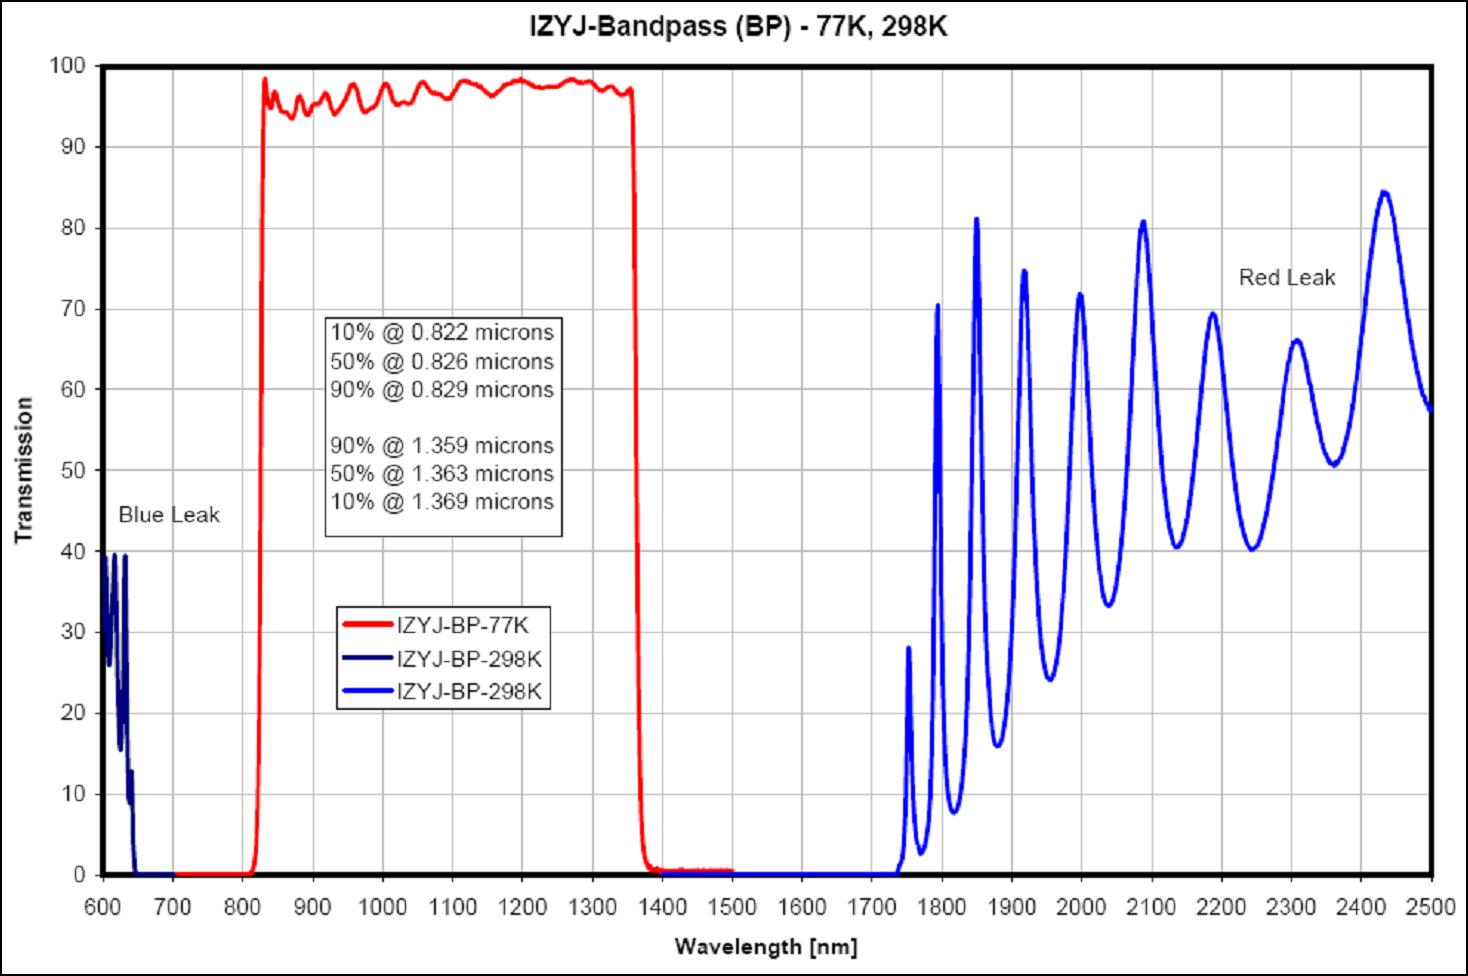
IZYJ-BP |
9296-2910 |
|
See Note 2 |
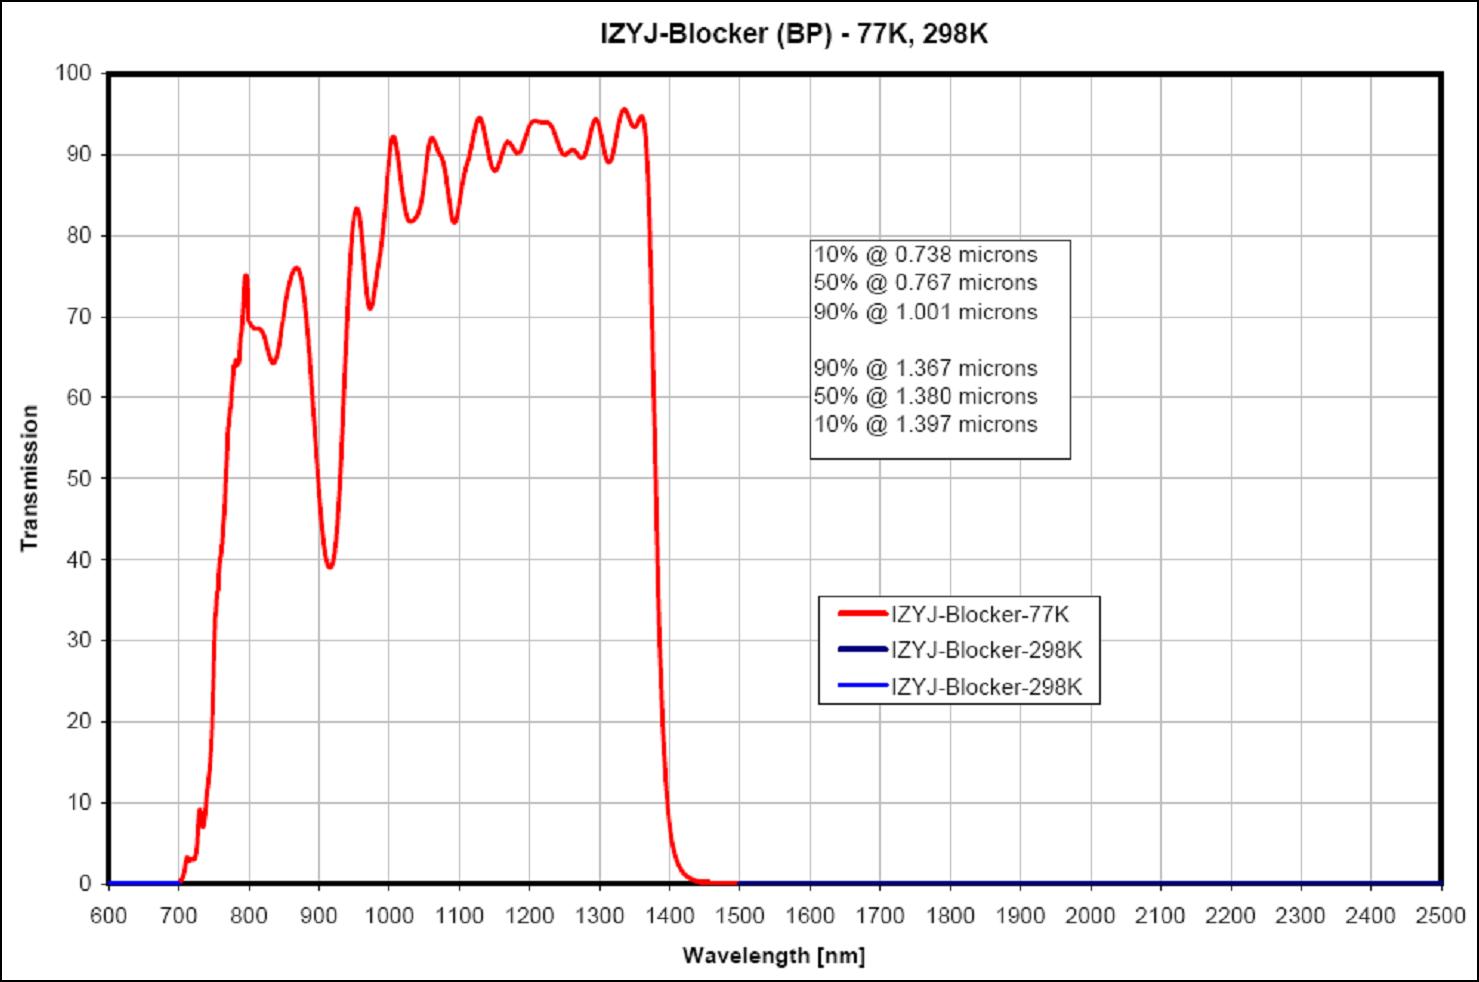
IZYJ-Blocker |
9297-2910 |
|
See Note 2 |
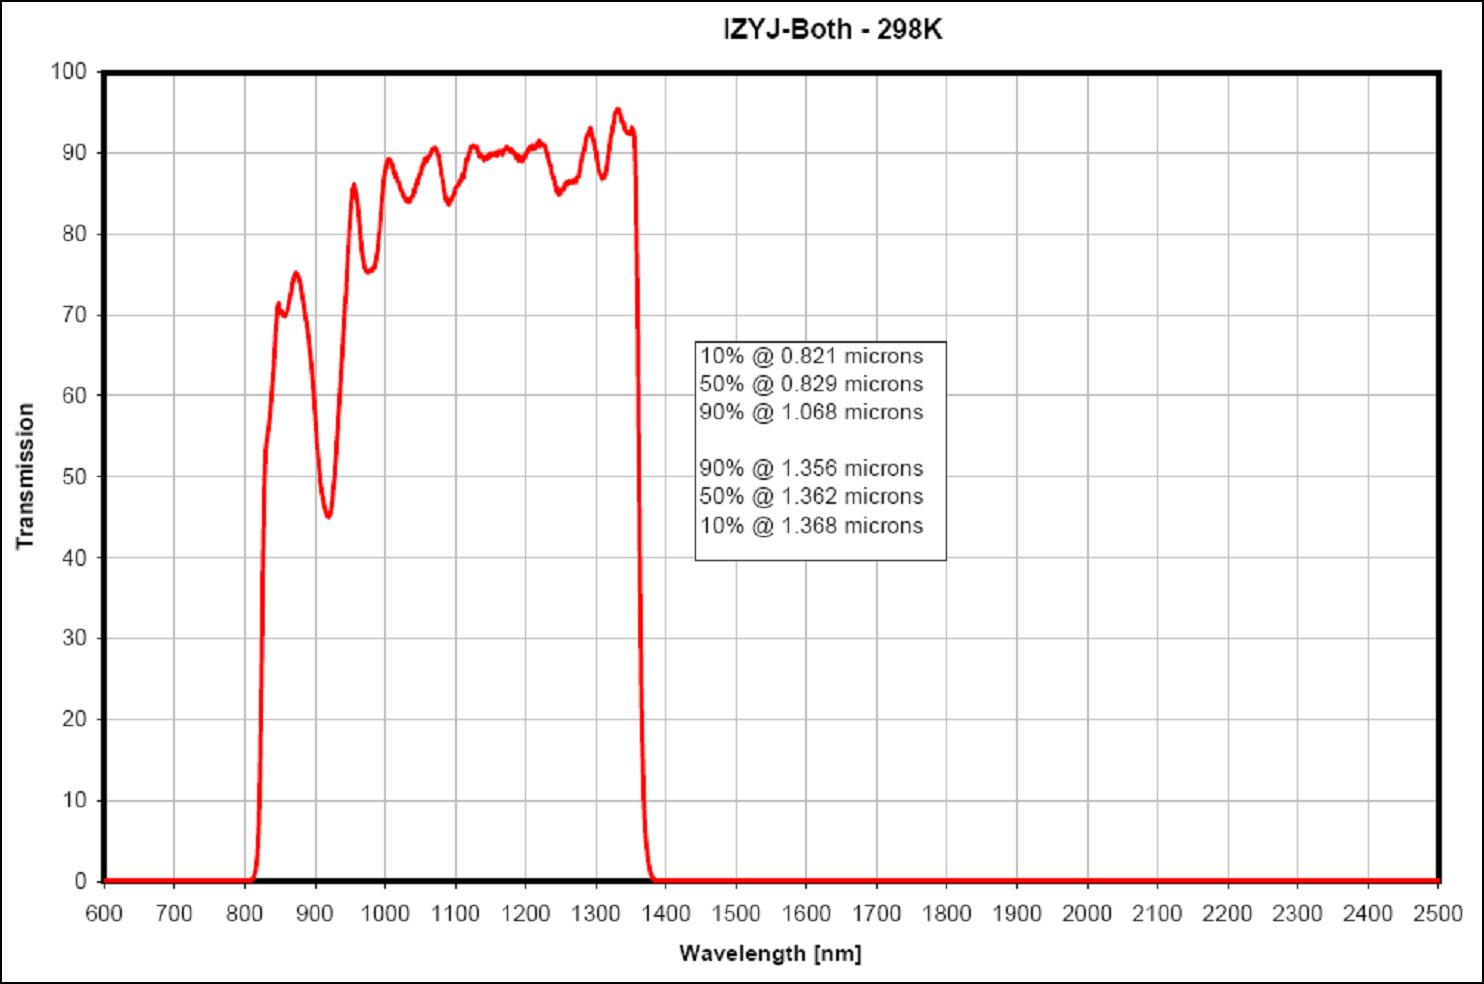
IZYJ-Both |
9296-2910
&
9297-2910 |
|
Barr_IZYJ-Both.dat
See Note 2 |
|
1.17LP |
ED026-2 |
|
|
1.40LP |
ED735-W |
|
|
|
1.85LP |
ED033-1 |
|
|
|
2.8LP |
ED031 |
|
|
*Our bandpass measurements
are preliminary ones done in the BU lab. Their wavelength basis is an
Argon emission lamp spectrum
whose 1.17-2.3 microns line positions were determined by eye to the nearest
Mimir detector pixel and a dispersion curve fit an calculated. The bandpass
data are of low quality in the J-band, where the JHK grism used has very
low efficiency.
Note 2: In the IZYJ data files and plots, points spanning 0.7-1.5 microns are from the 77K Barr tests, points outside that range are from their 298K tests
|