Mimir - ZEMAX Spectroscopy Detector Maps |
||
|
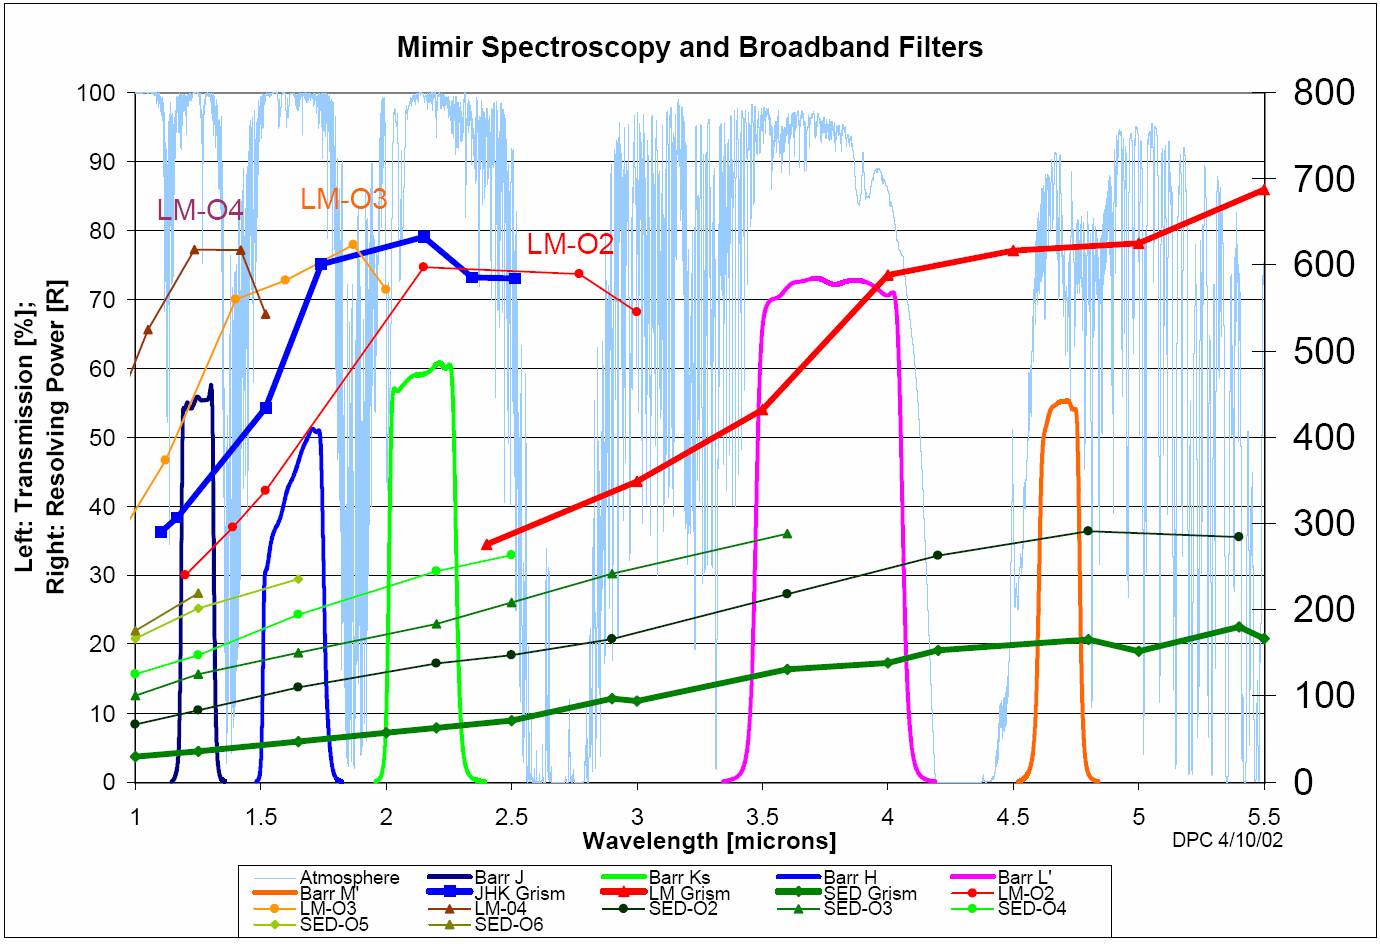
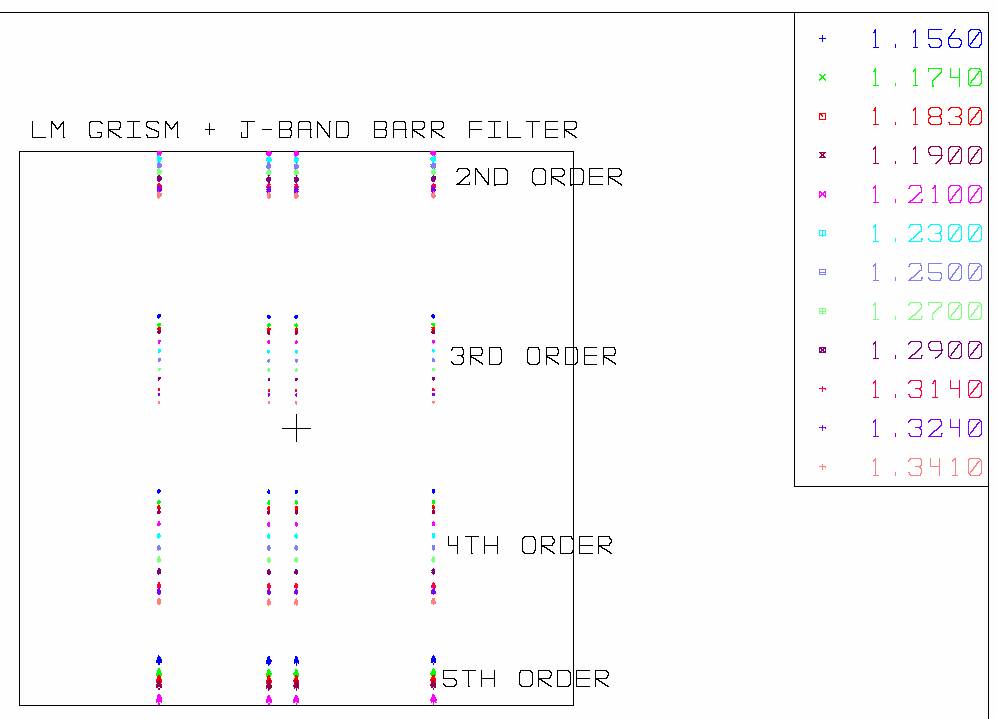
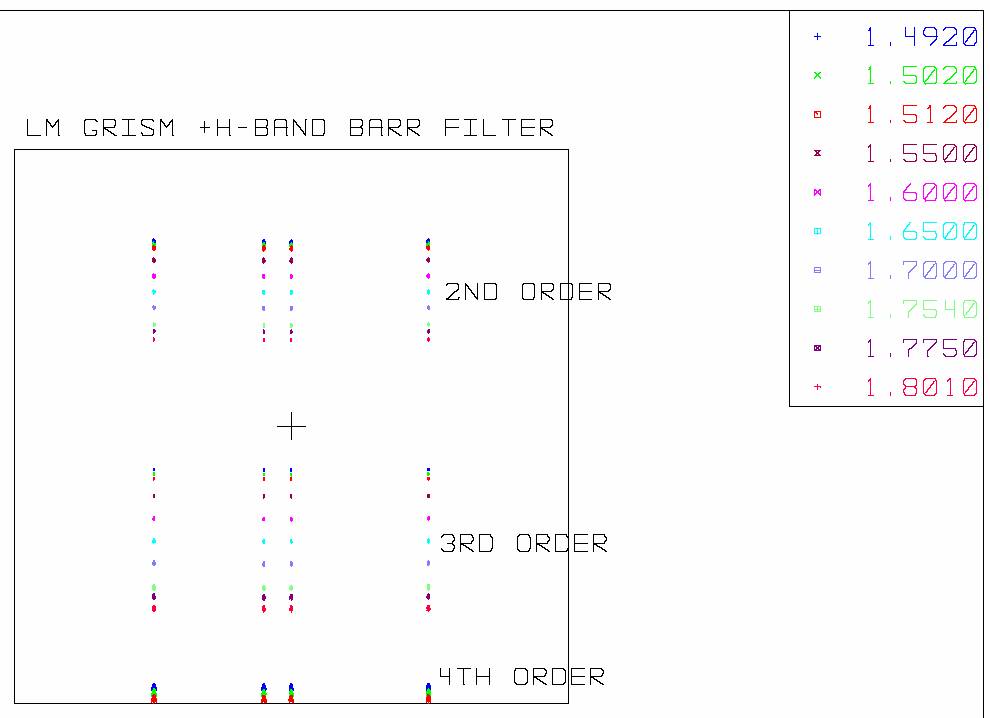
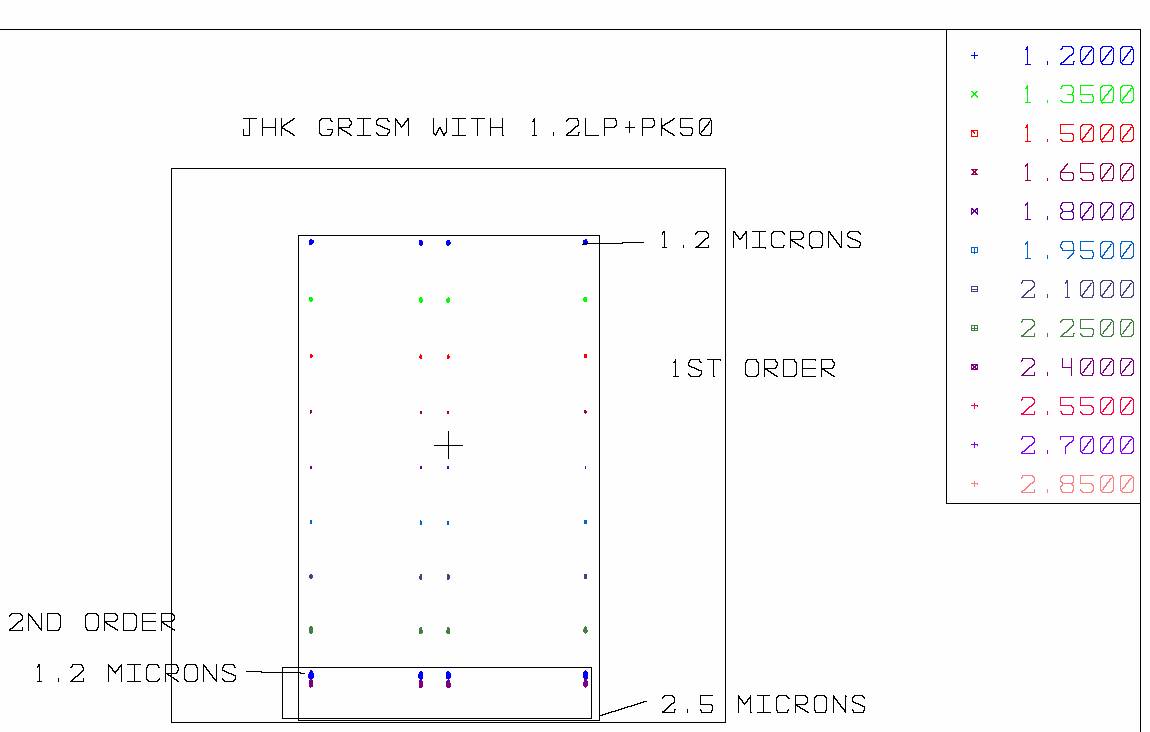
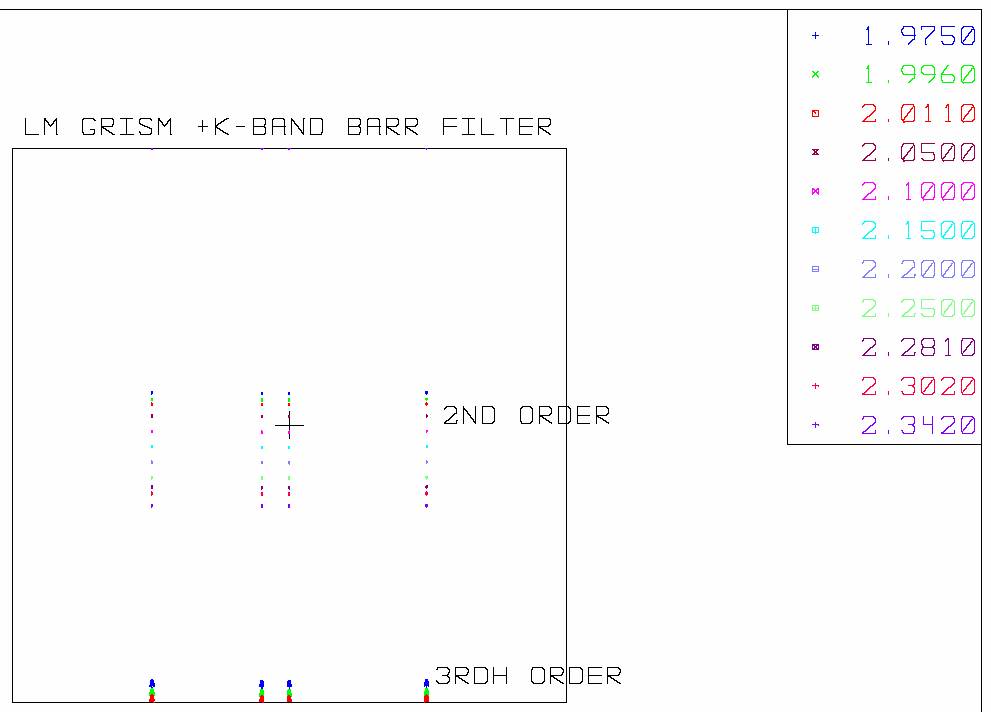
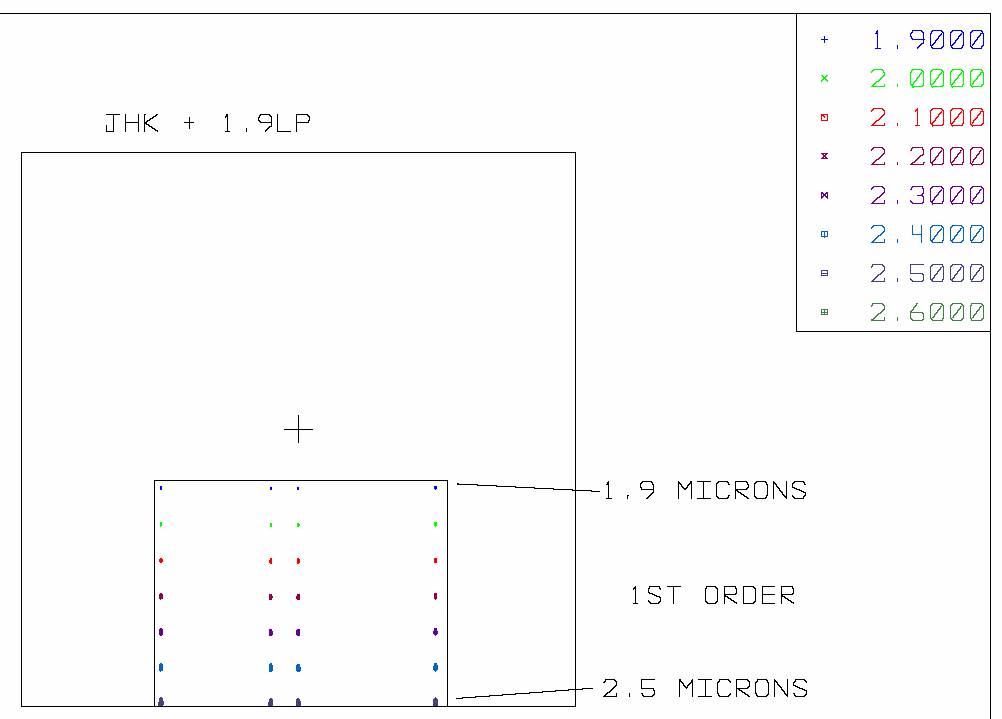
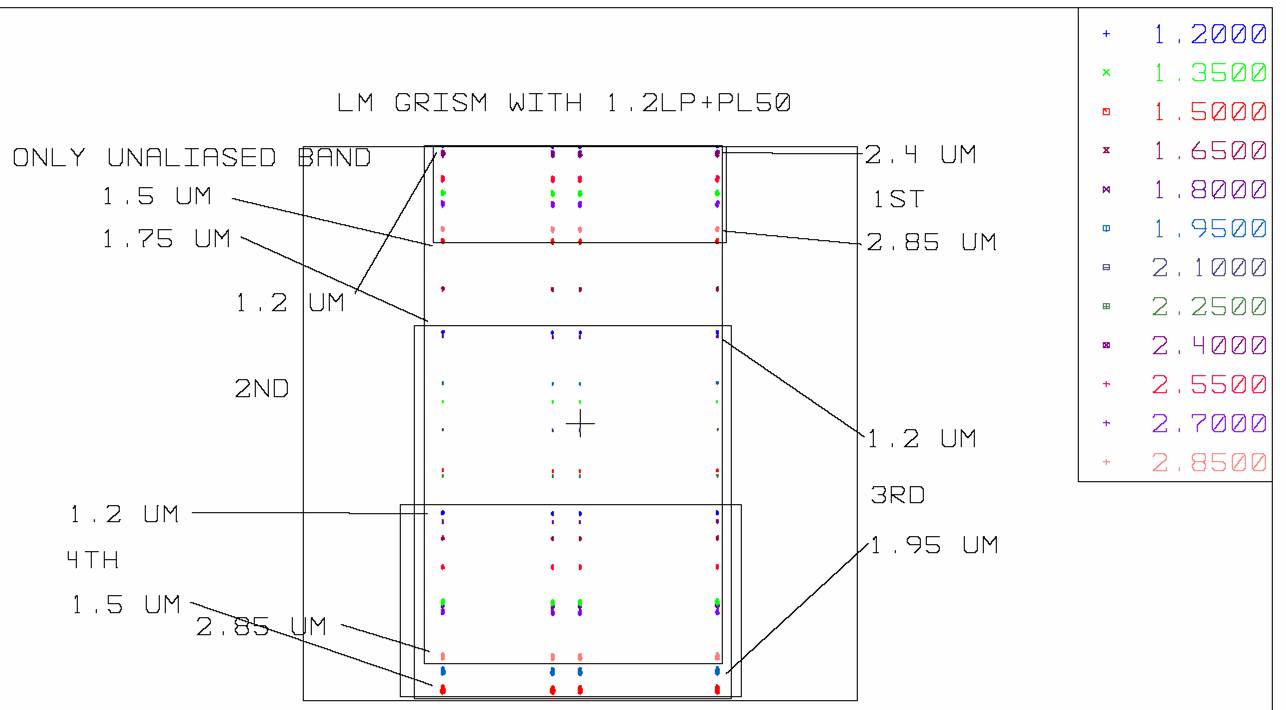
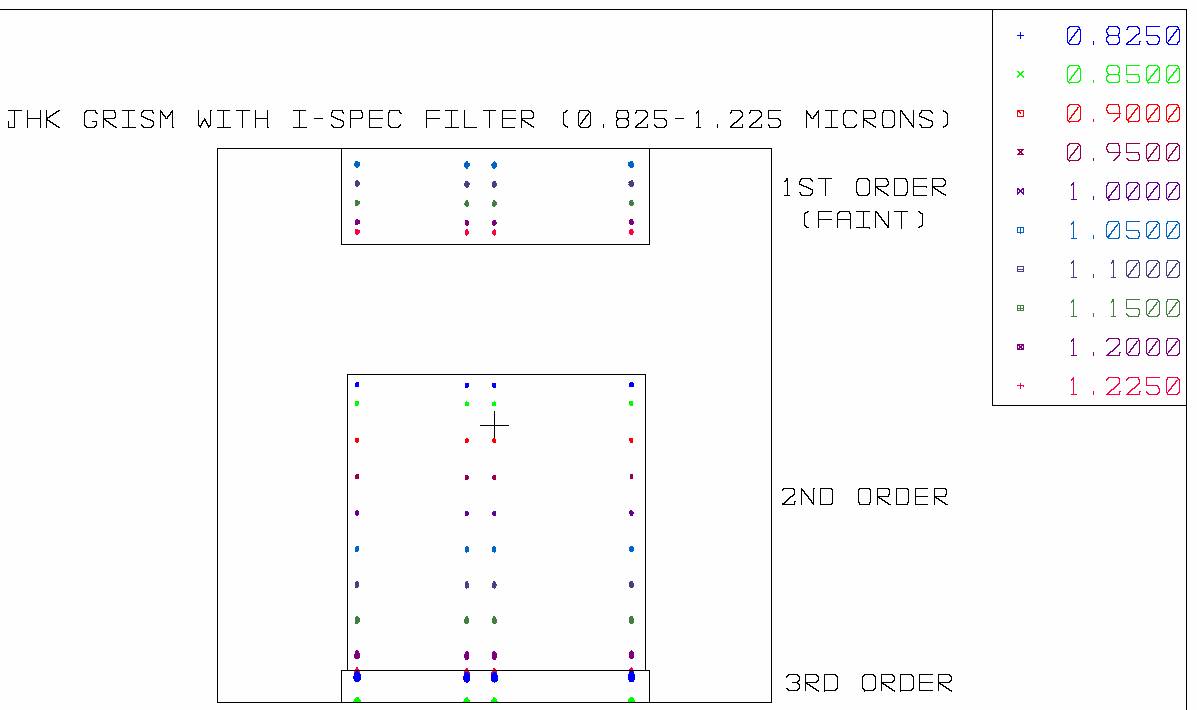
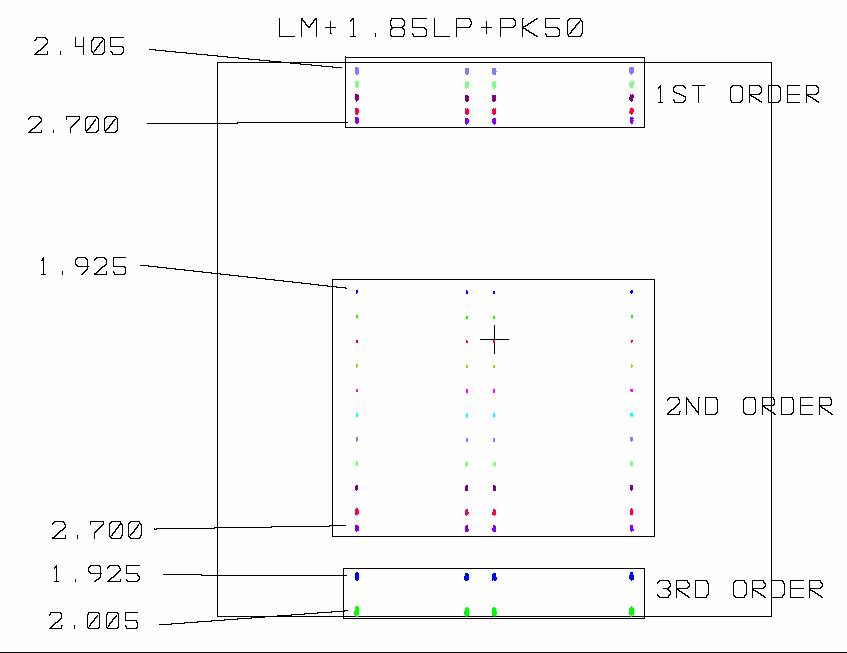
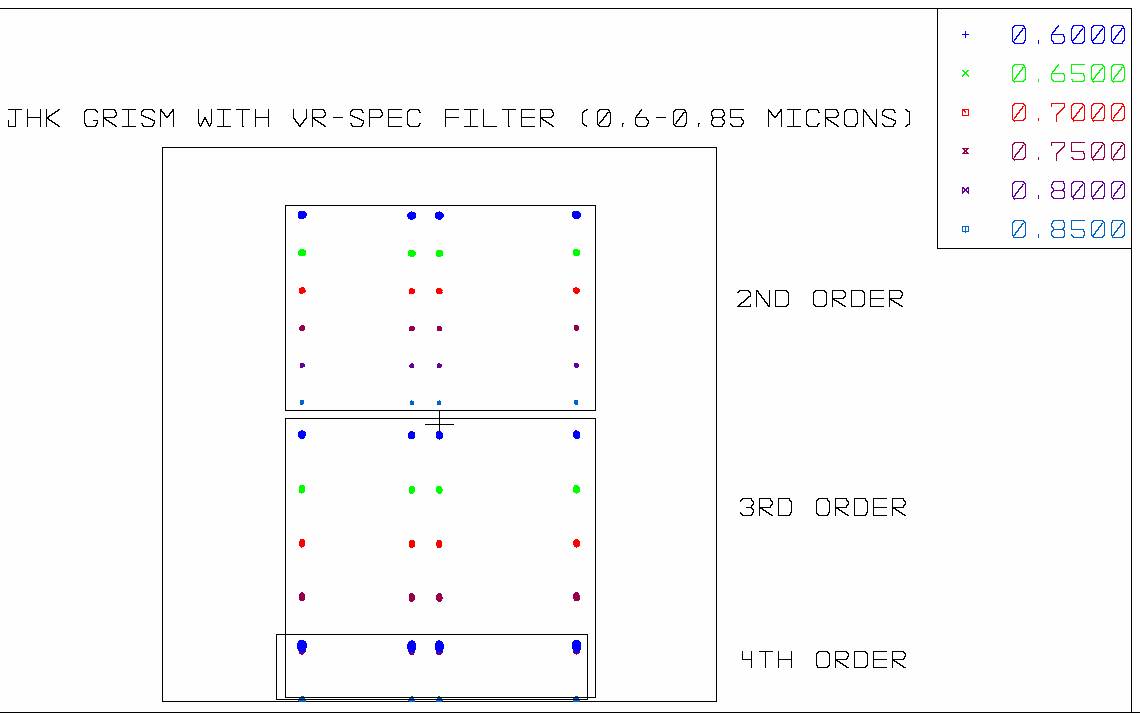
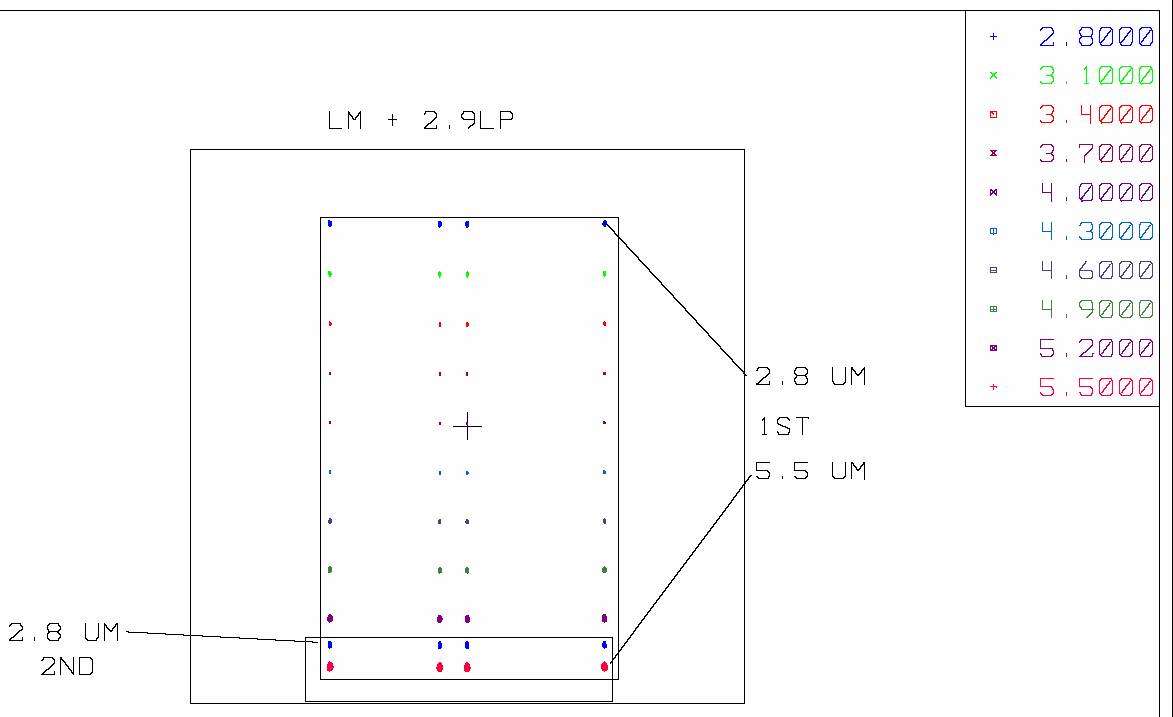
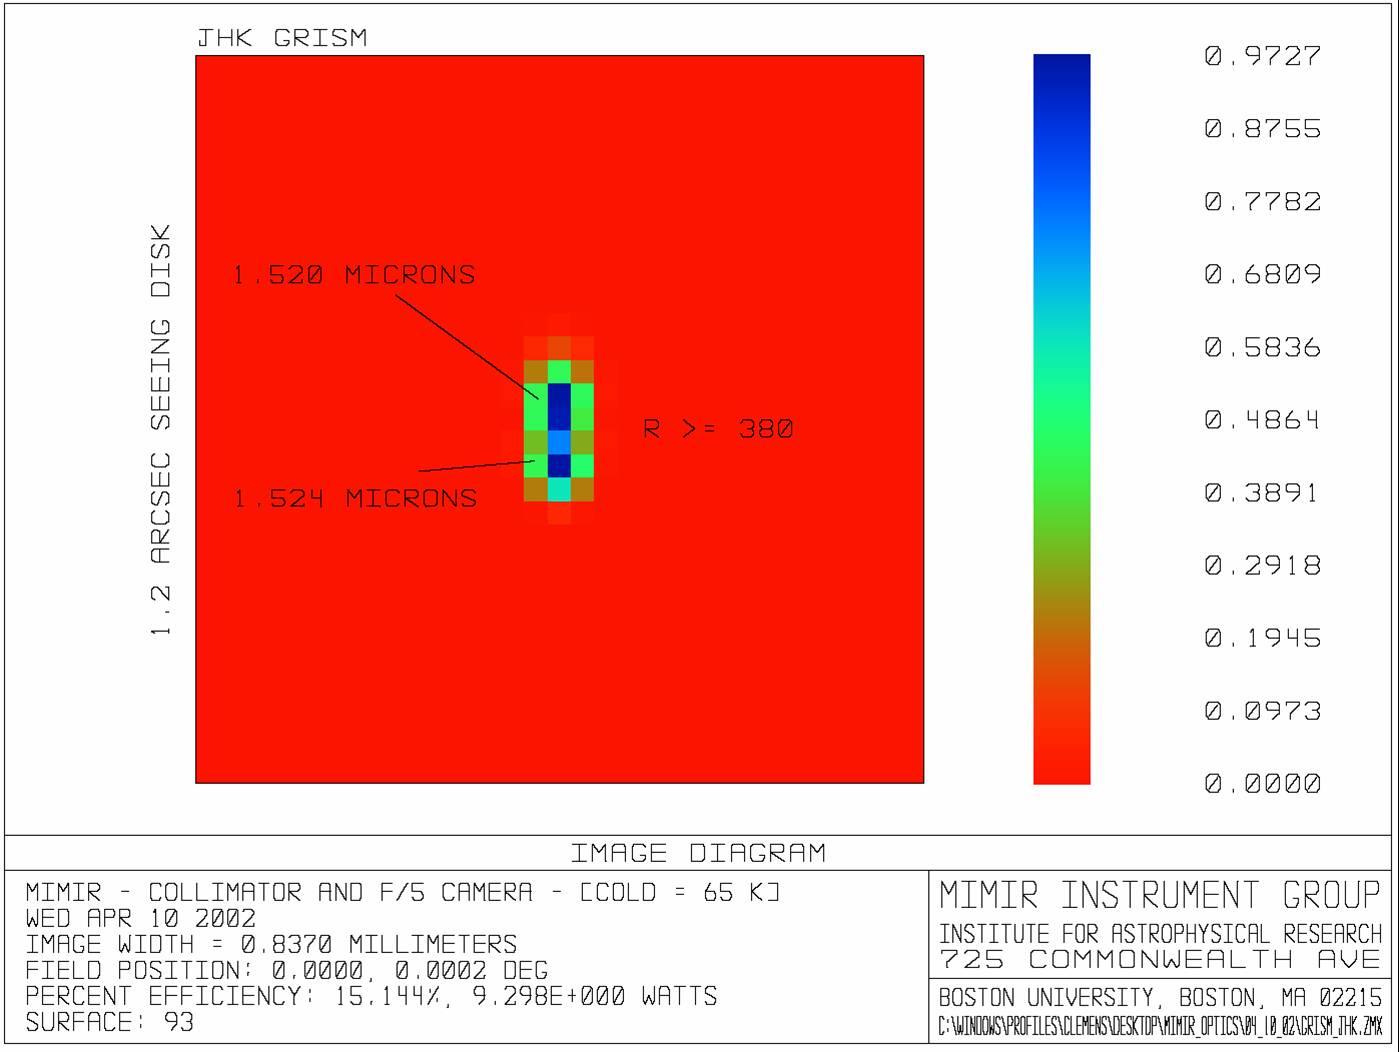
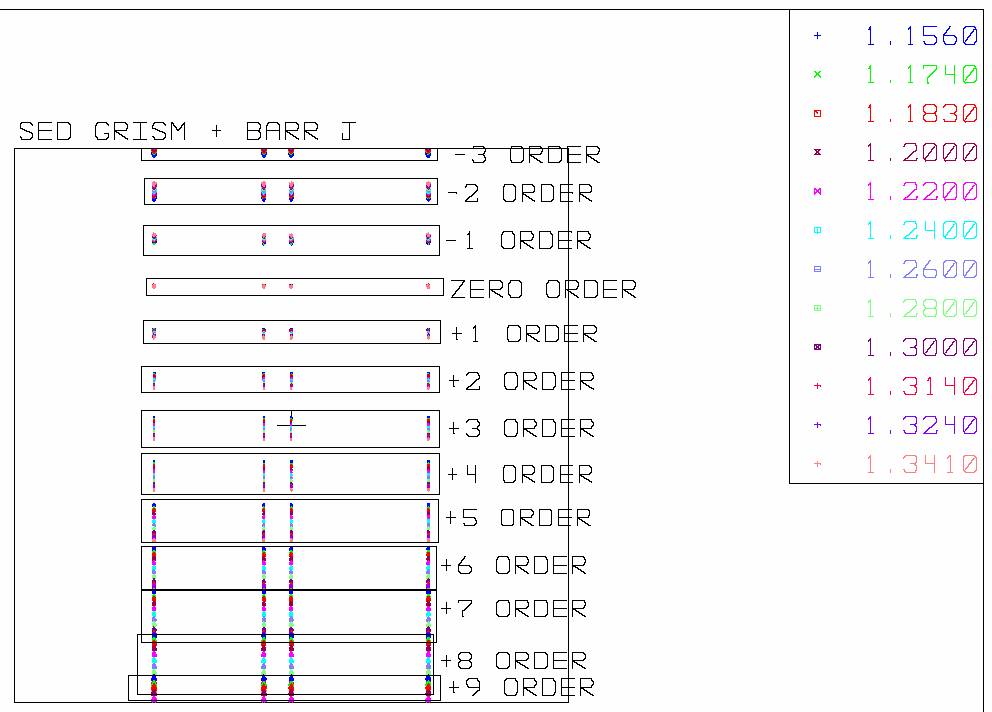
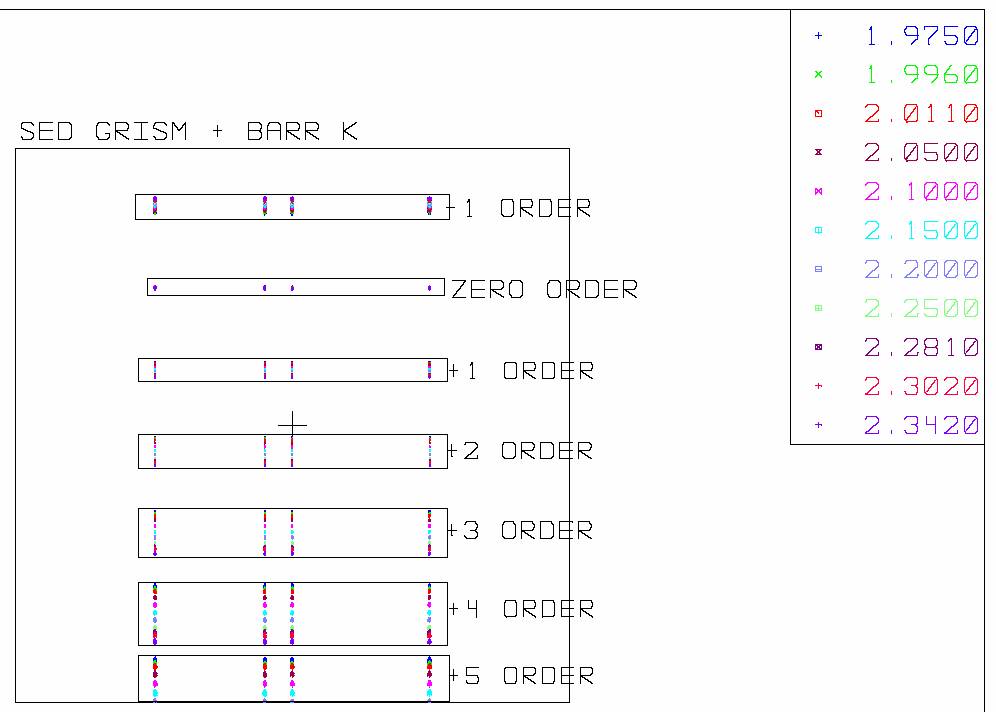
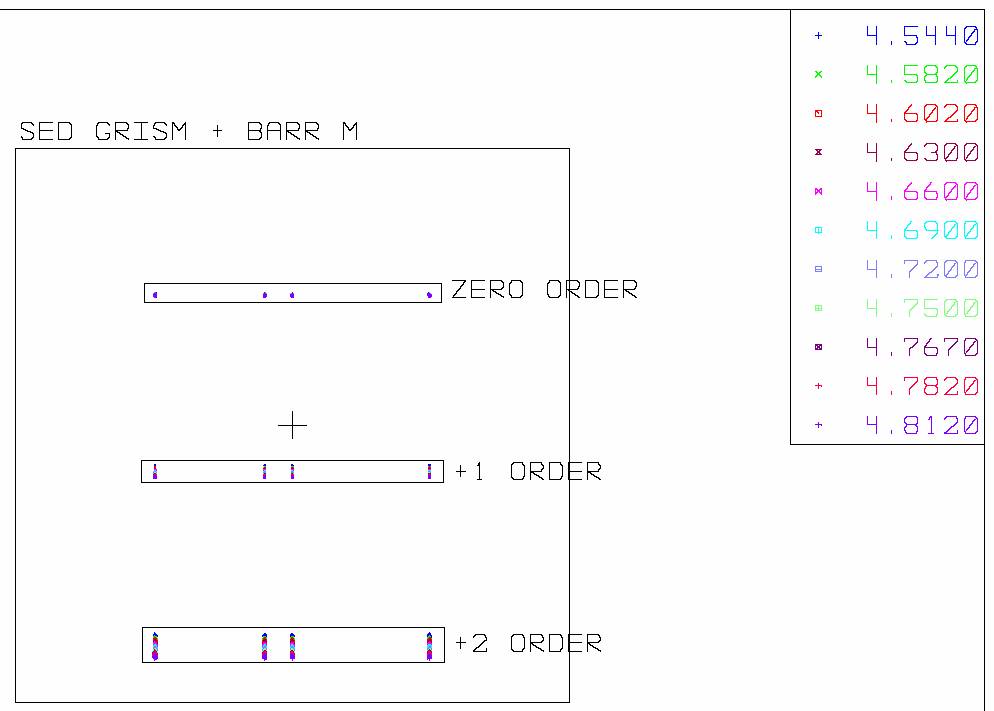
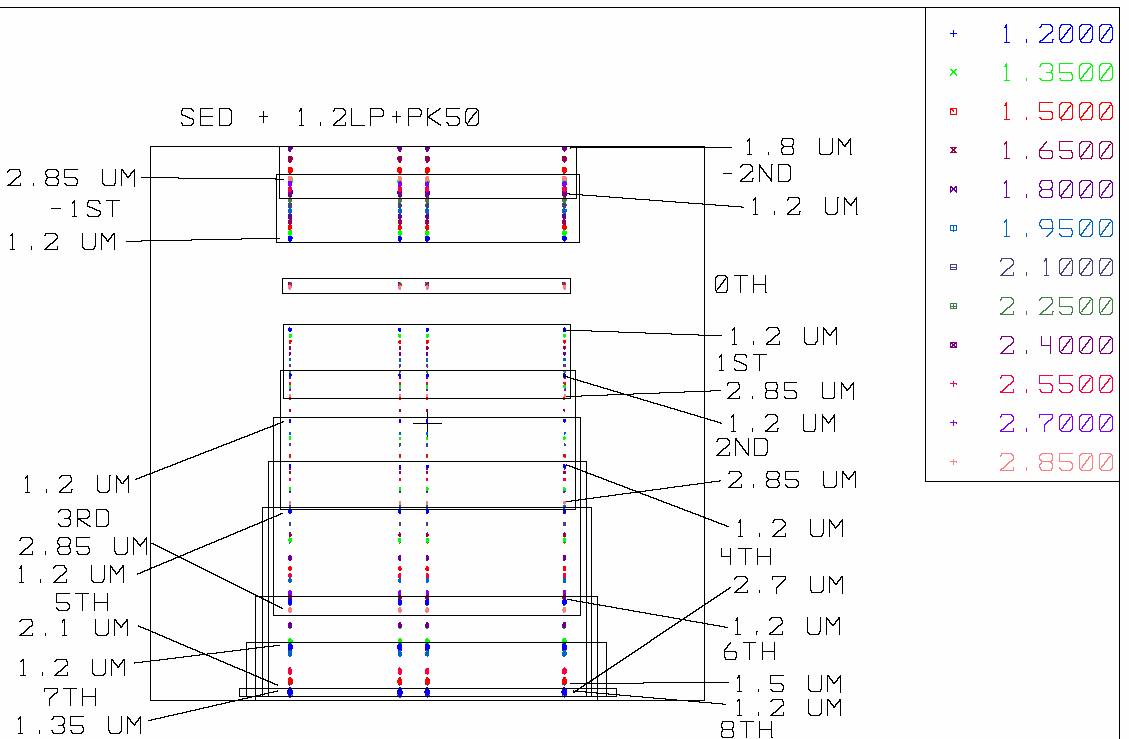
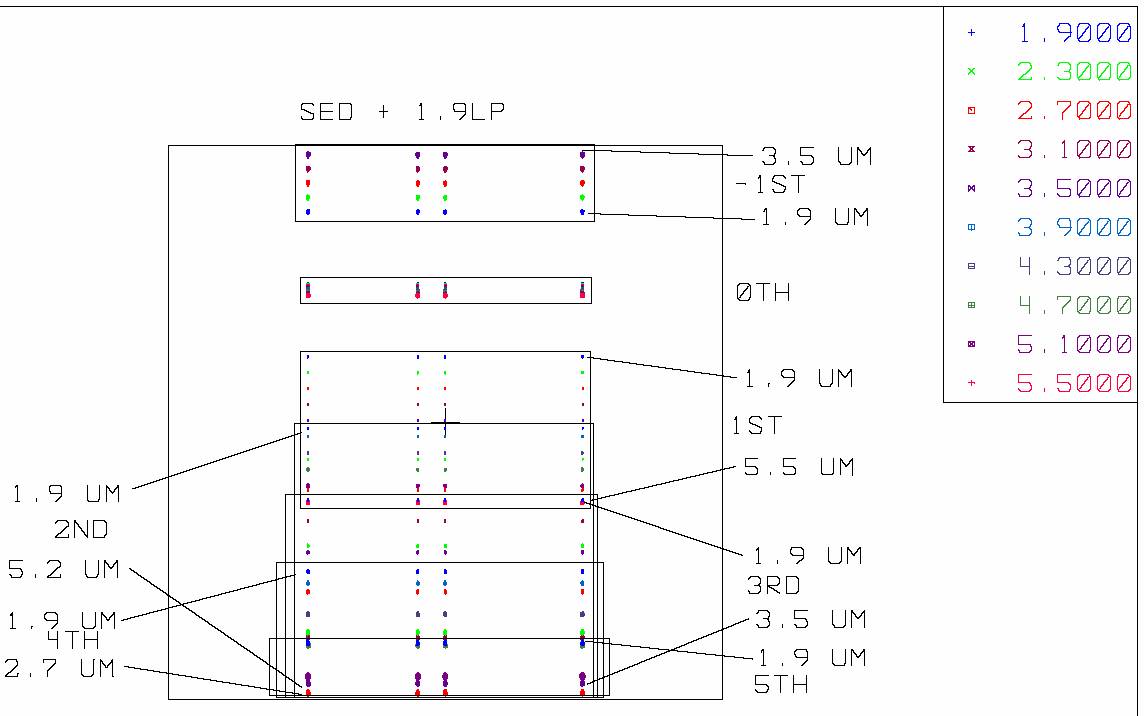
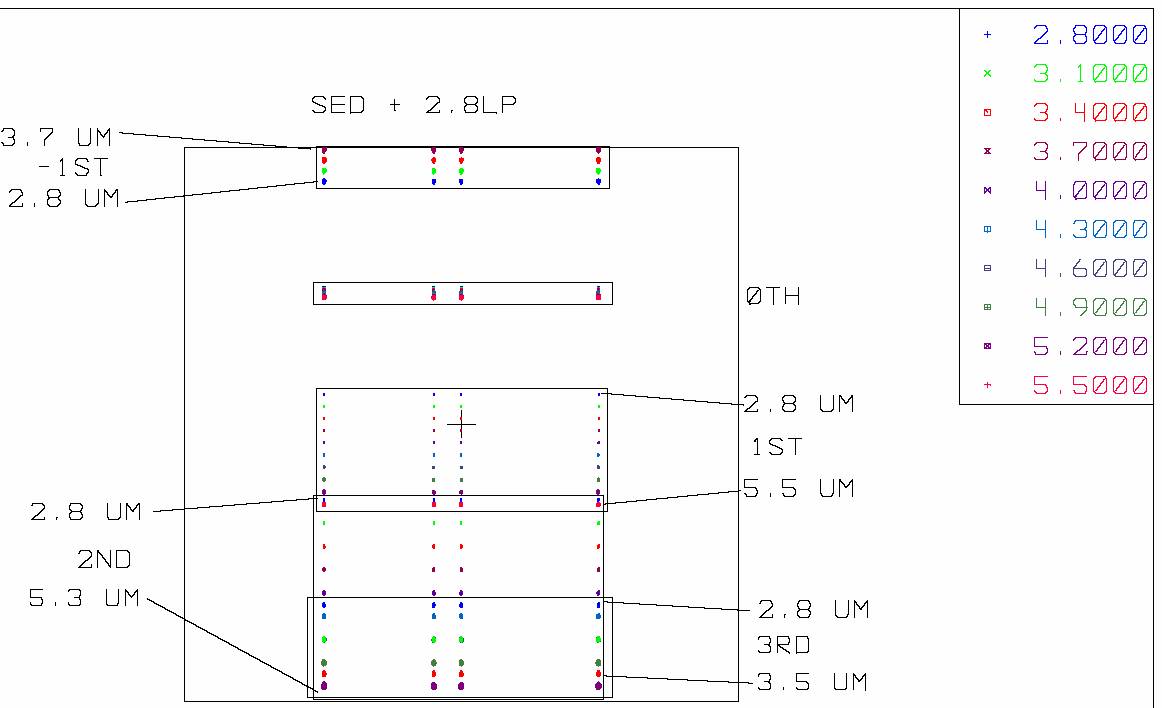
These show where on the detector light will fall for various grism and filter combinations. Note that the dispersion direction is up-down (short to long wavelength) in these plots, which is 90 degrees rotated from the actual left-right (short -> long) dispersion in actual Mimir images. These maps were calculated for the F/5 camera, but can be extended to the F/17 by expanding the central pixels by a factor of 3.333 about 512 - that is, column 359 (F/5) becomes column 1 (F/17) and column 665 (F/5) becomes column 1024 (F/17). These plots do not indicate efficiencies - this must be determined using Marc Buie's IDL tool. For any plot, click the thumbnail to see the full plot
|