| Description | Figure |
|---|---|
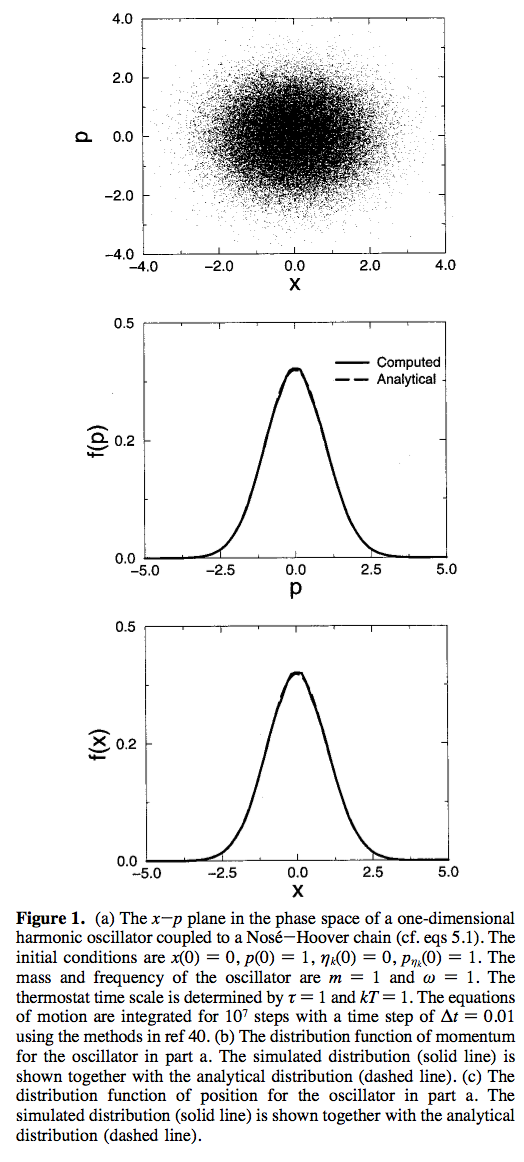
| This figure is from a chemical physics journal. Many chemists in the field of theoretical chemistry will publish in journals like this one. The exhibit is comprised of three related figures that are combined. The top plot is a scatter plot with no trend shown, whereas the bottom two plot the expected trend on top of the data. Notice that the caption contains sufficient data for the reader to form an understanding of the data. DOI: 10.1021/jp992433y Tuckerman, M. E.; Martyna, G. J. J. Phys. Chem. B, 2000, 104 (2), pp 159–178 |
 |
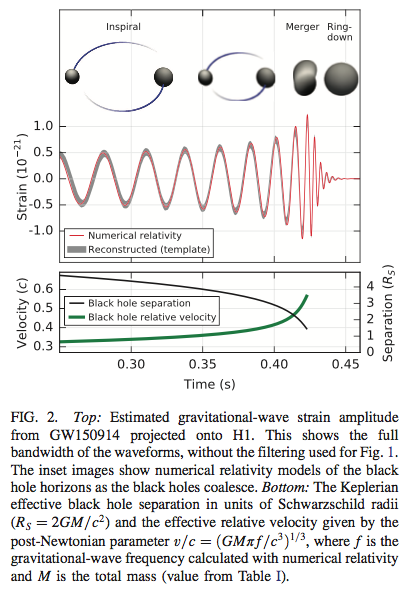
| This figure is from a physics journal (PRL), and is from the first paper reporting the observation of gravitational waves. The figure combines three different data sets (velocity, separation, and strain) on the same axes -- notice that they have the same time scale. Additionally, the authors have included a cartoon above the data sets in order to illustrate what is taking place at these times. DOI: https://doi.org/10.1103/PhysRevLett.116.061102 Abbott, B. P.; et al. Phys. Rev. Lett., 2016, 116 (2), pp 061102 |
 |
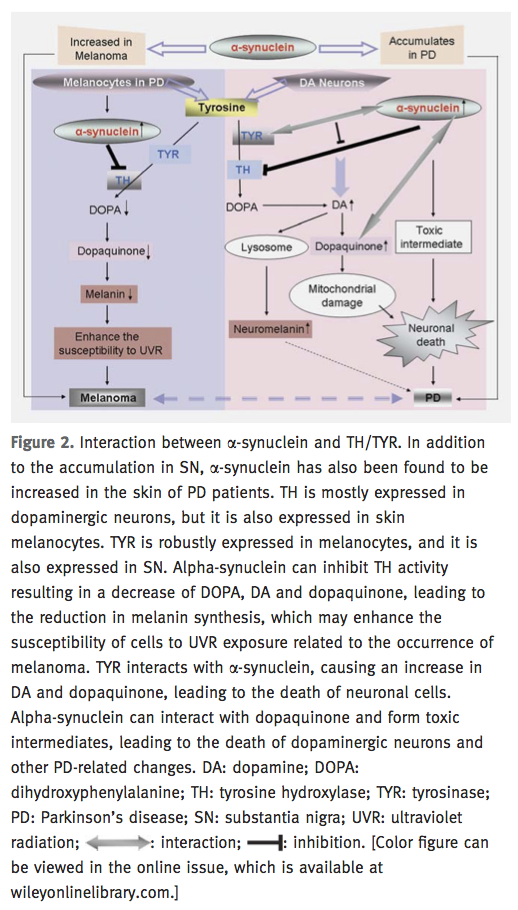
| There is a common misconception that biologists and chemists do not format figures the same -- this simply isn't true. This figure is from a reputable medical journal, specializing in cancer, and the paper connect neuroscience with cancer research. The scheme presented shows the relationships between the molecules and genes involved in both melanoma and Parkinson's disease. Notice that the caption has a very strong narrative, and also includes how to important features of the figure. DOI: 10.1002/ijc.25912 Pan, T.; et. al.Int. J. Cancer, 2011, 128, pp 2251-2260 |
 |
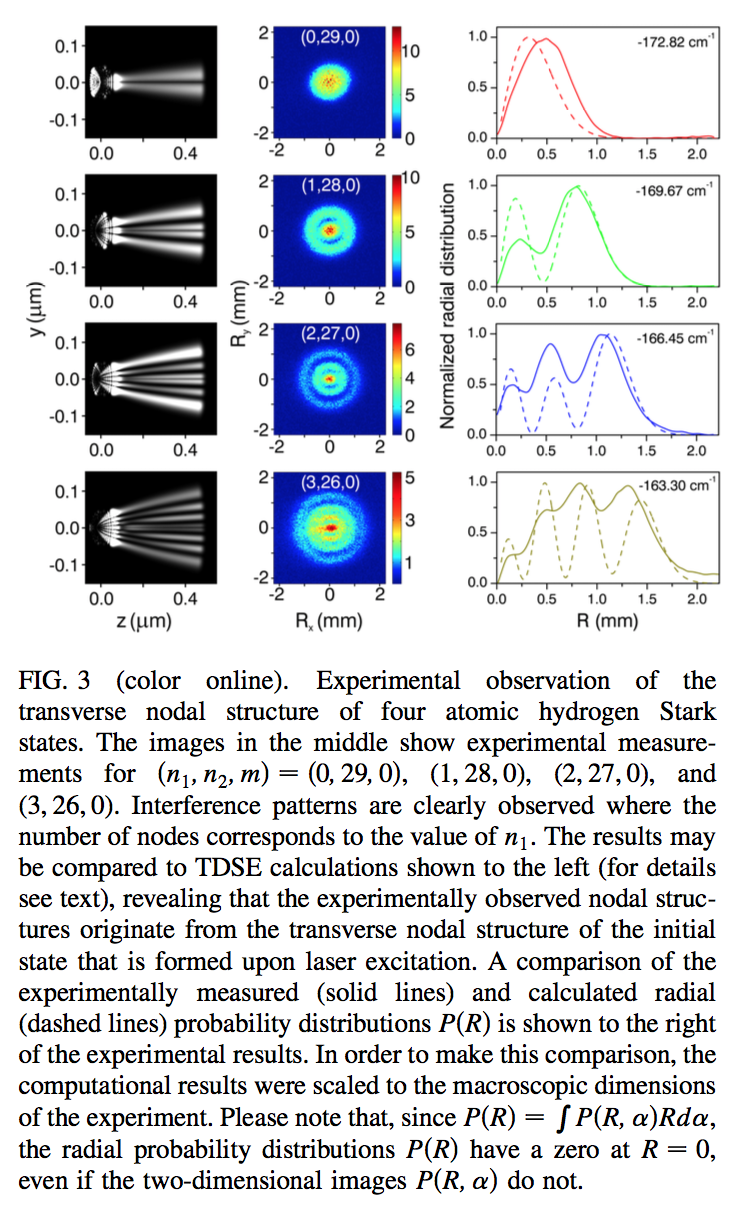
| Another PRL article, this time about observing the hydrogen atom electron cloud (what list of awesome figures wouldn't include something like this?!) Notice how all of the plots in the figure have the same scale. In this way, the reader can infer immediately about things like size, spacial extent, and distribution from a glance. Also, notice the use of solid and dashed lines to differentiate between expected and observed dat, and the use of a color scale for two-dimensional data. DOI: 10.1103/PhysRevLett.110.213001 Stodolna, A. S.; et. al.Phys. Rev. Lett., 2013, 110 (21), pp 213001 |
 |
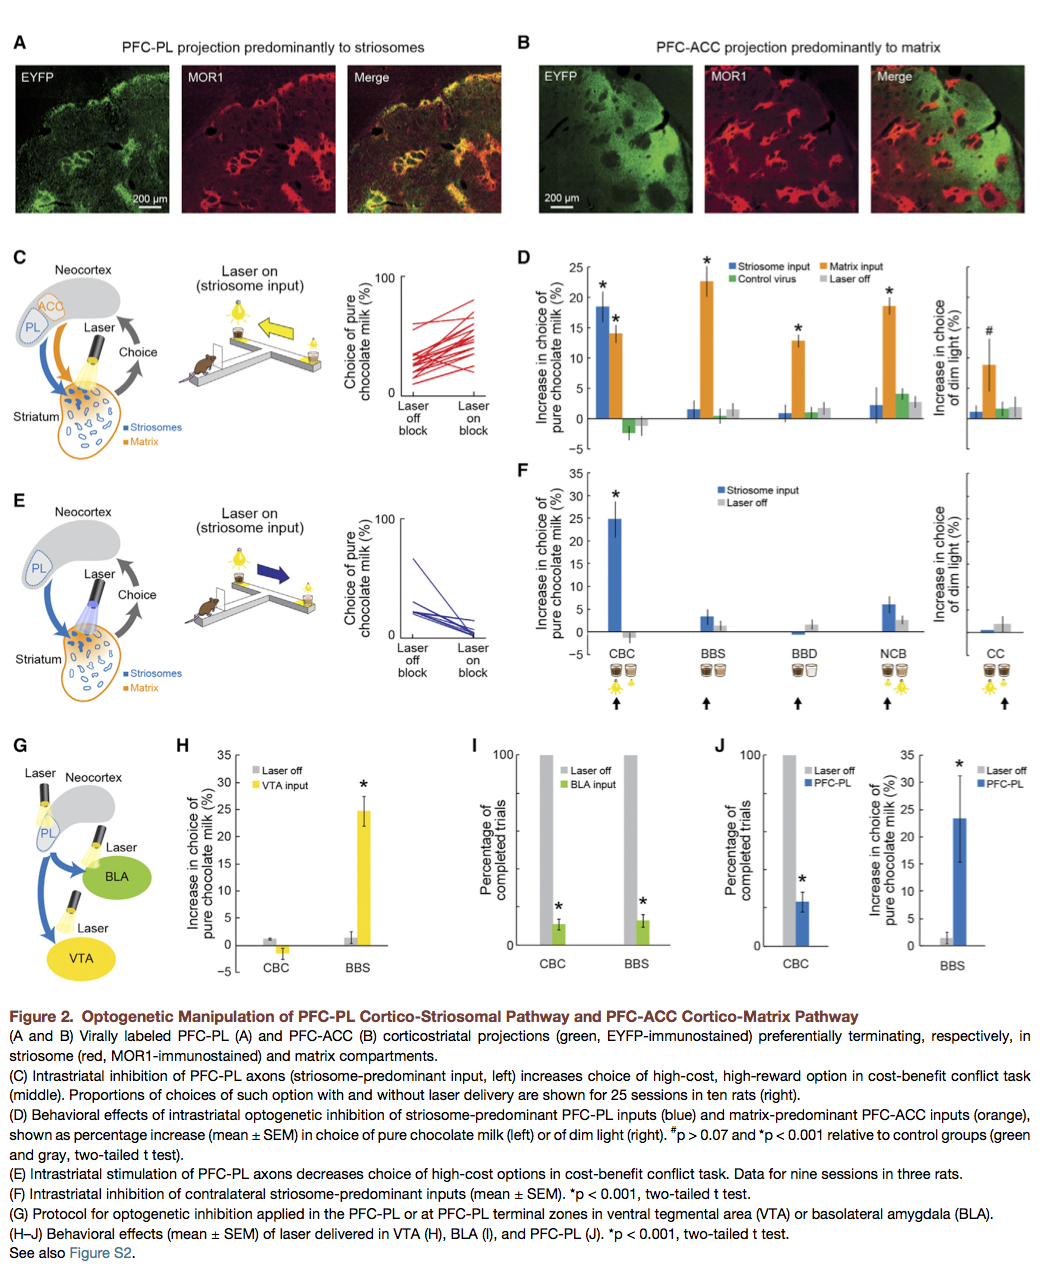
| Some of the higher impact journals include Nature, Science, and Cell. In the biology community, publishing a Cell paper is considered to be extremely diserable. This figure comes from a Neuroscience paper published in Cell. You'll notice that this figure contains the full gambit of data involved in a certain part of the study. In order to make sense of this much data, the caption describes each portion of the figure in detail. DOI: 10.1016/j.cell.2015.04.049 Friedman, A.; et. al.Cell, 2015, 161, pp 1320-1333 |
 |
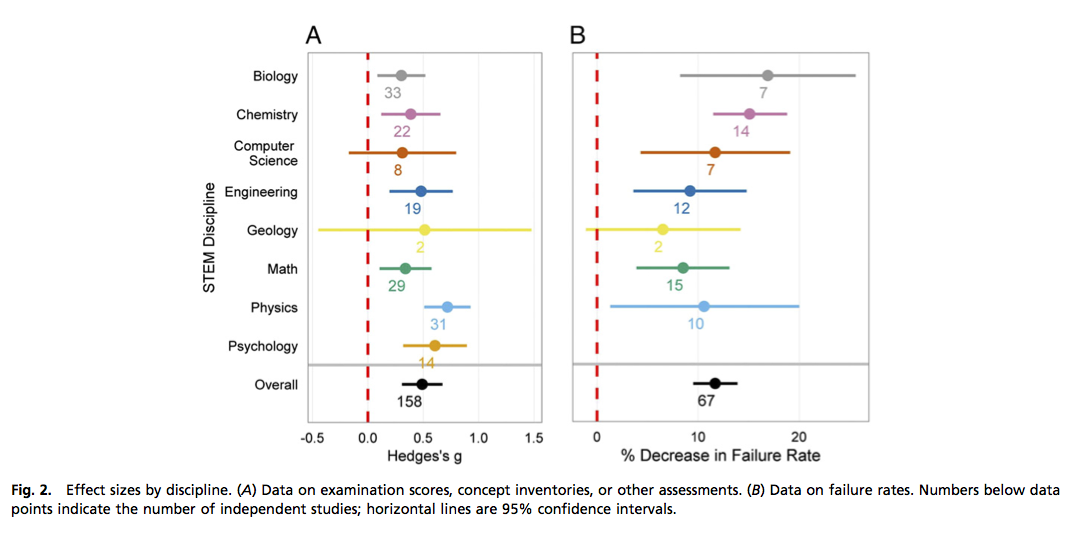
| Proceedings of the National Academy of Sciences (or PNAS) is a very prestigious journal that publishes research in just about every science discipline. This figure comes from an education research paper published in PNAS. Notice the careful use of color to differentiate between the different disciplines being studied. Furthermore, notice how the authors make sure to plot the data in the same order in both parts of the figure -- in this way, it is trivial to compare different measures for each one, and between the different disciplines studied. DOI: 10.1073/pnas.1319030111 Freeman, S.; et. al.PNAS, 2014, 111 (23), pp 8410-8415 |
 |
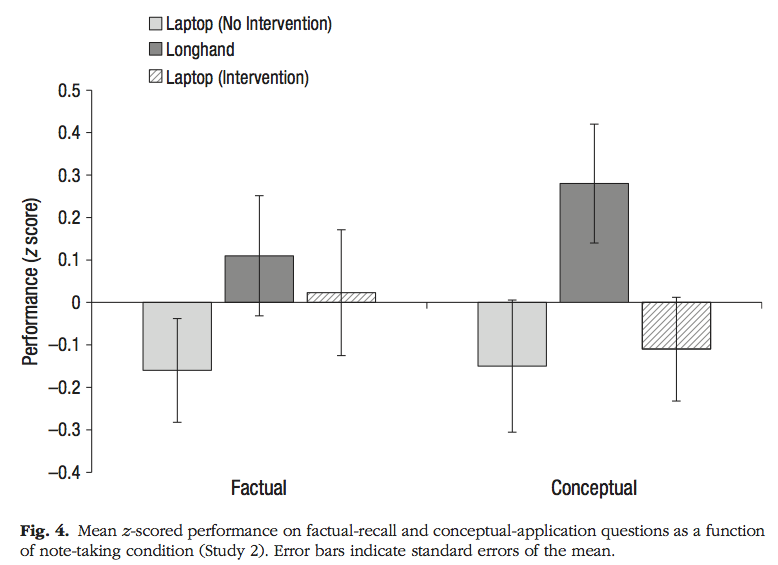
| Here is a figure from a very interesting paper on methods of note-taking and their effectiveness, published in a psychology journal. The inclusion of error bars in the figure allow the reader to gauge the level of uncertainty in each data point presented. A legend is included that does not take too much space away from the data in the actual figure. DOI: 10.1177/0956797614524581 Mueller, P.A.; Oppenheimer, D. M. Psychological Science, 2014, 25 (6). |
 |
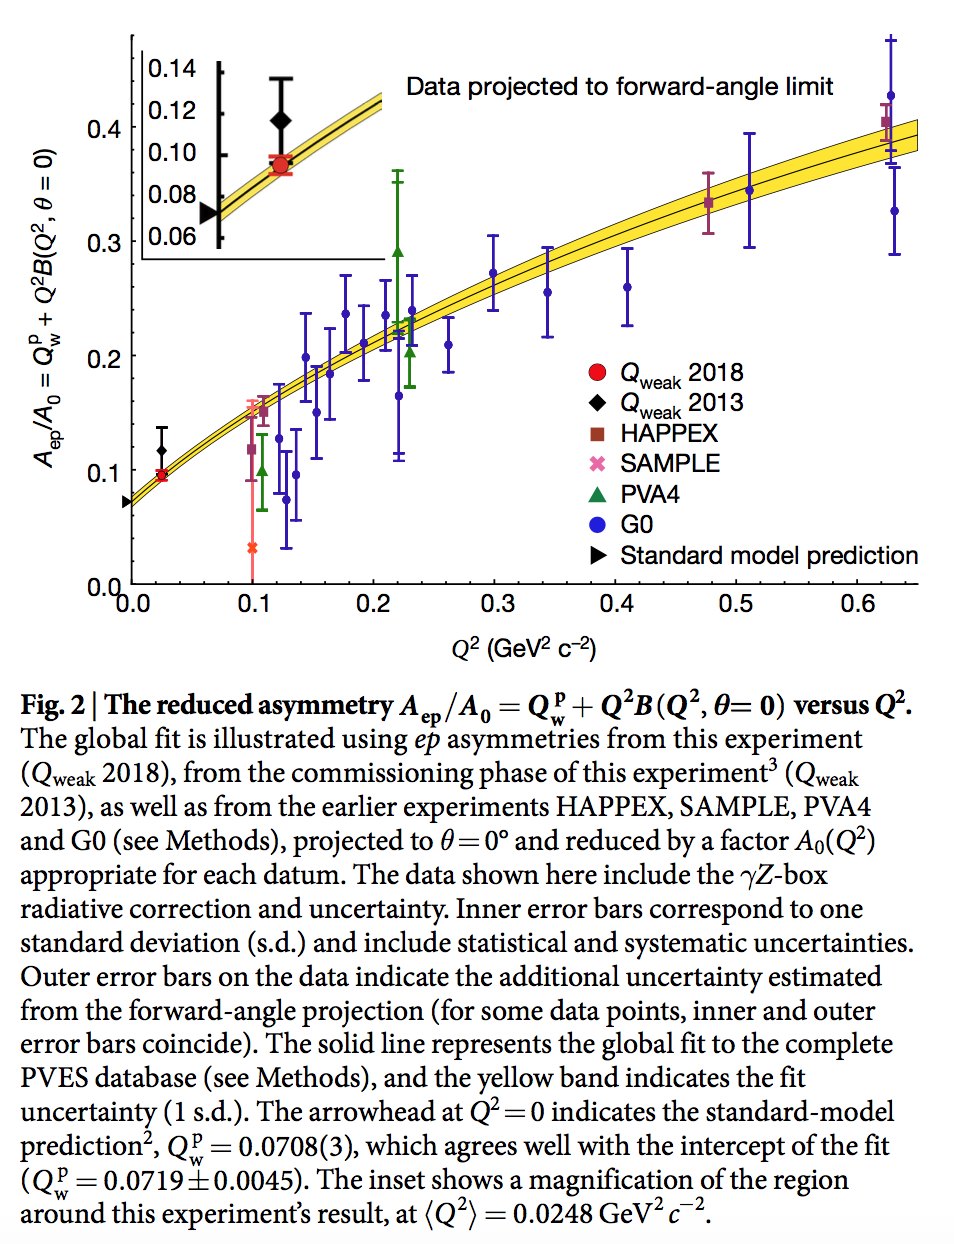
| From Nature: measurement of the weak charge of the proton. DOI: 10.1038/s41586-018-0096-0 The Jefferson Lab Qweak CollaborationNature, 2018, 557, pp 207 |
 |
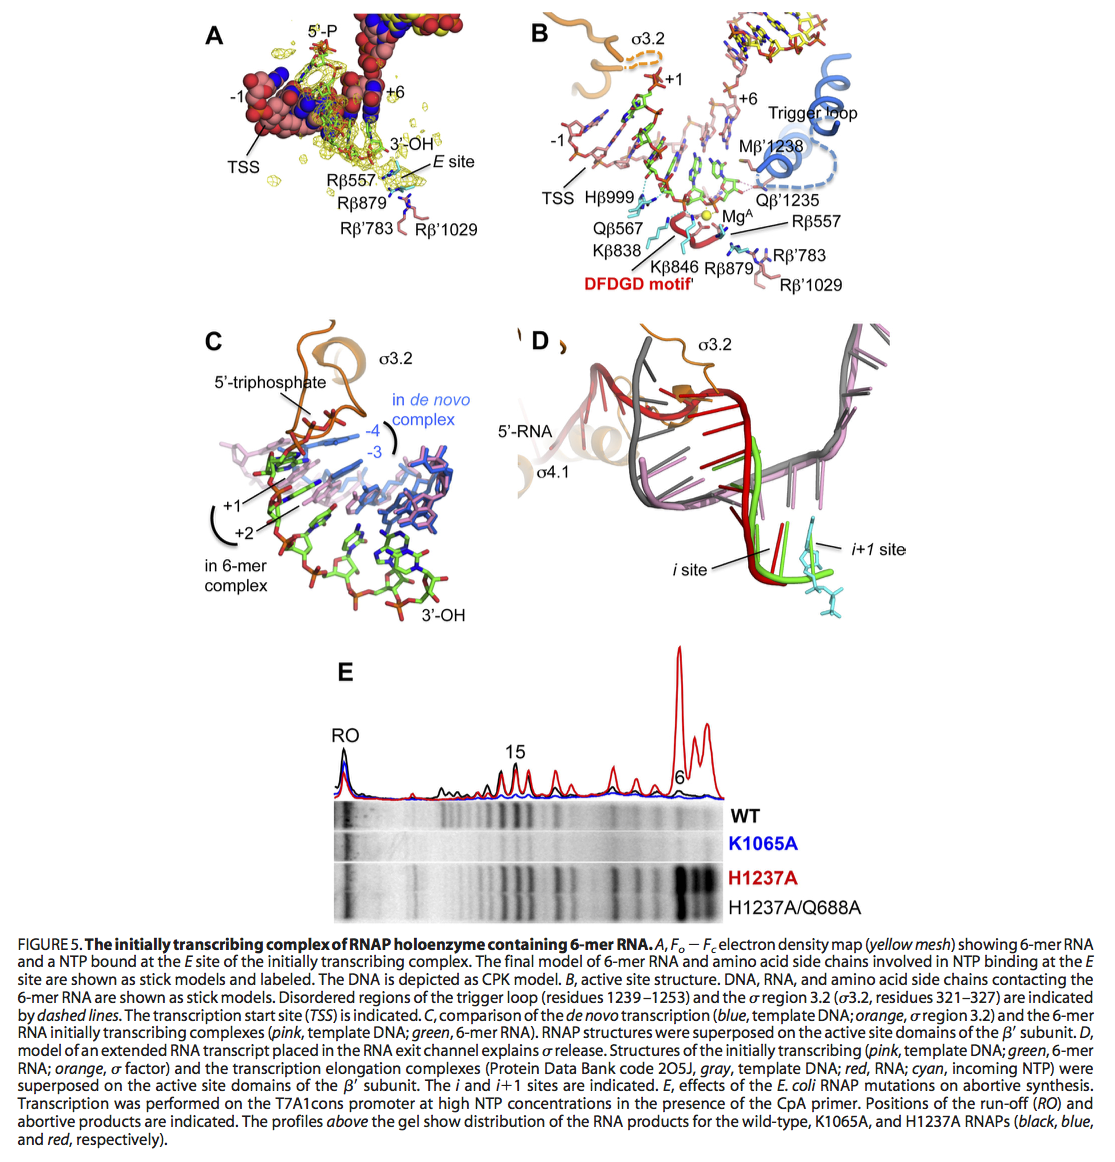
| From the Journal of Biological Chemistry DOI 10.1074/jbc.M114.584037 Basu, R. S.J. Biol. Chem., 2014, 289 (35), pp 24549-24559 |
 |
| Description | Table |
|---|---|
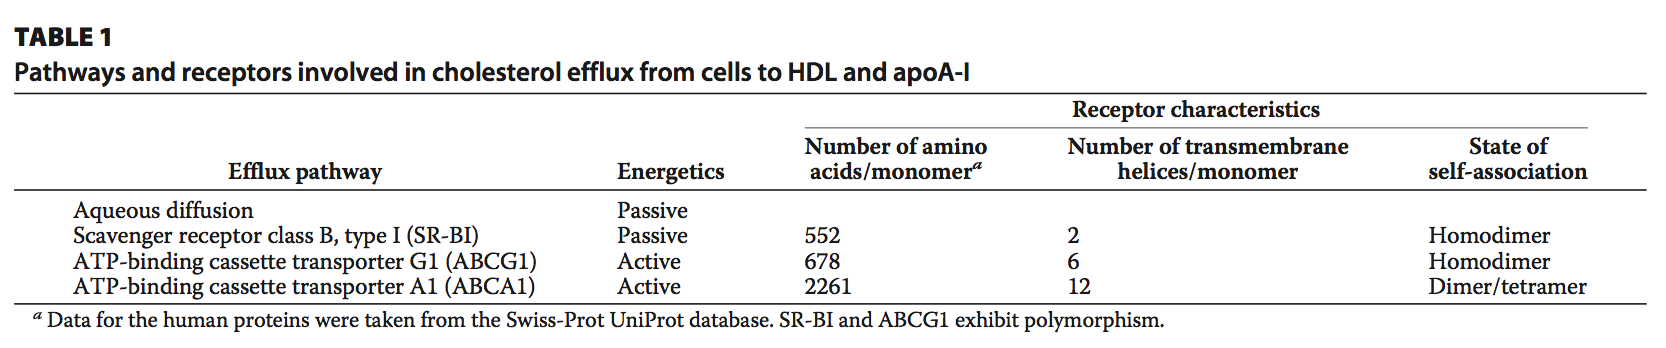
| From the Journal of Biological Chemistry DOI 10.1074/jbc.R114.583658 Phillips, M. C. J. Biol. Chem., 2014, 289 (35), pp 24020-24029 |
 |
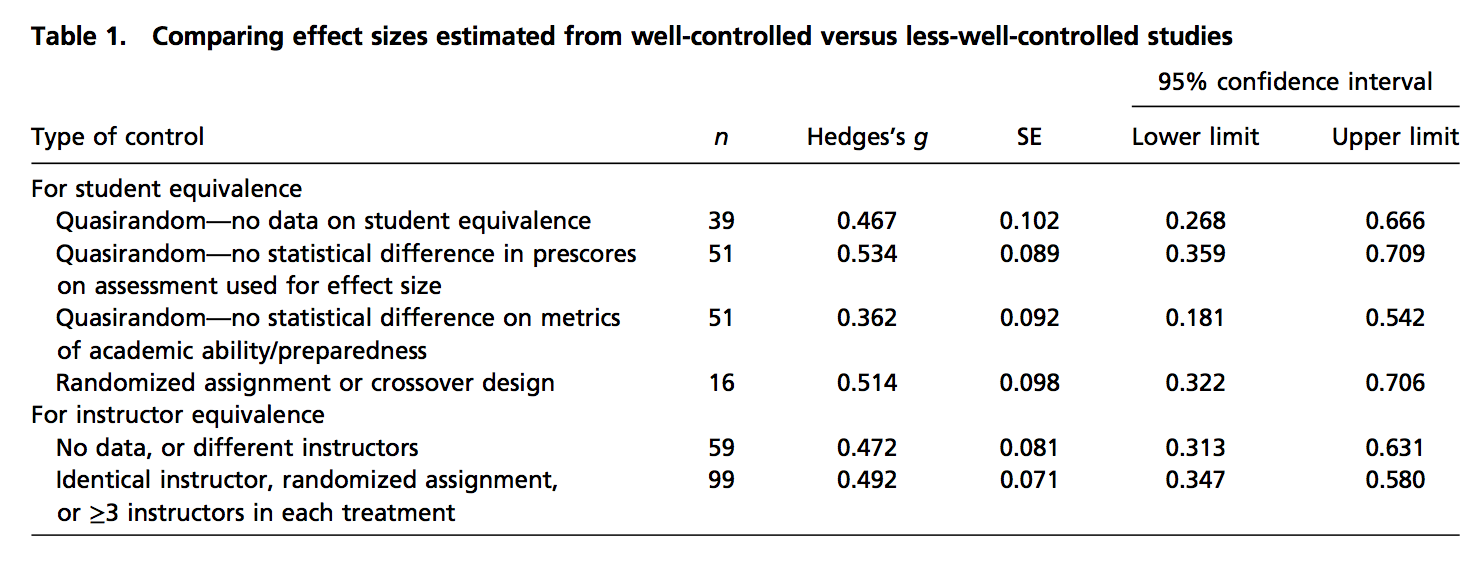
| From PNAS: an education research paper. DOI: 10.1073/pnas.1319030111 Freeman, S.; et. al.PNAS, 2014, 111 (23), pp 8410-8415 |
 |
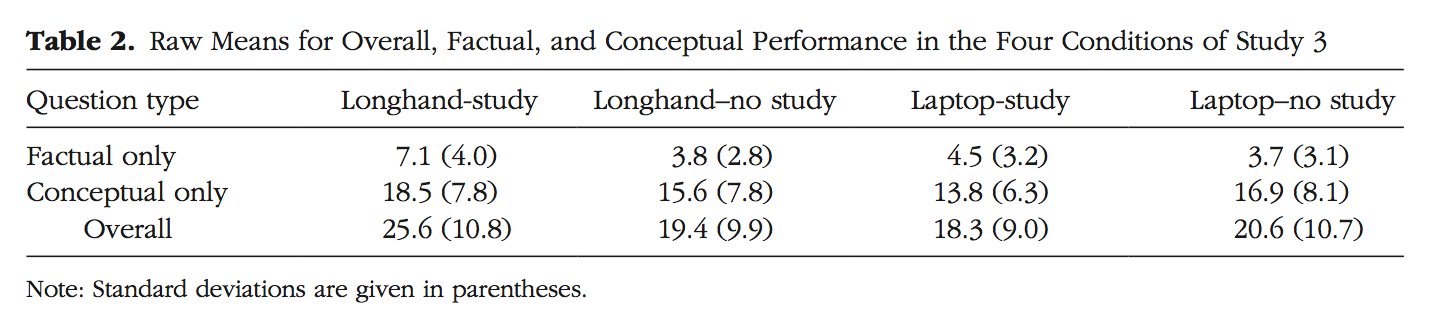
| From a psychology journal. DOI: 10.1177/0956797614524581 Mueller, P.A.; Oppenheimer, D. M. Psychological Science, 2014, 25 (6). |
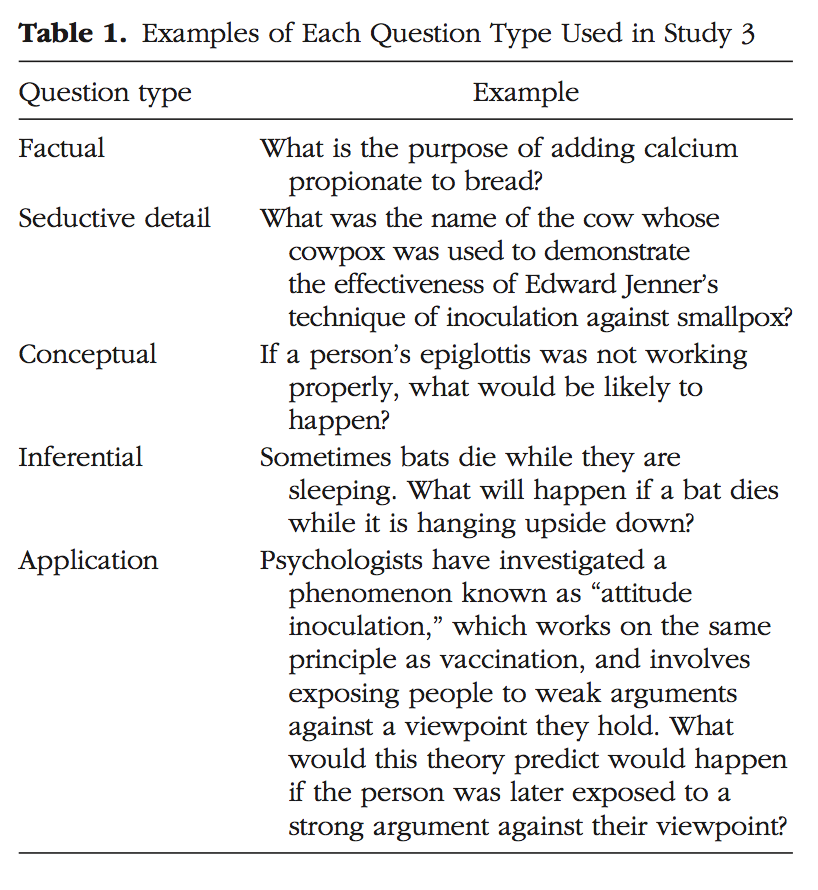 |
| From a psychology journal. DOI: 10.1177/0956797614524581 Mueller, P.A.; Oppenheimer, D. M. Psychological Science, 2014, 25 (6). |
 |
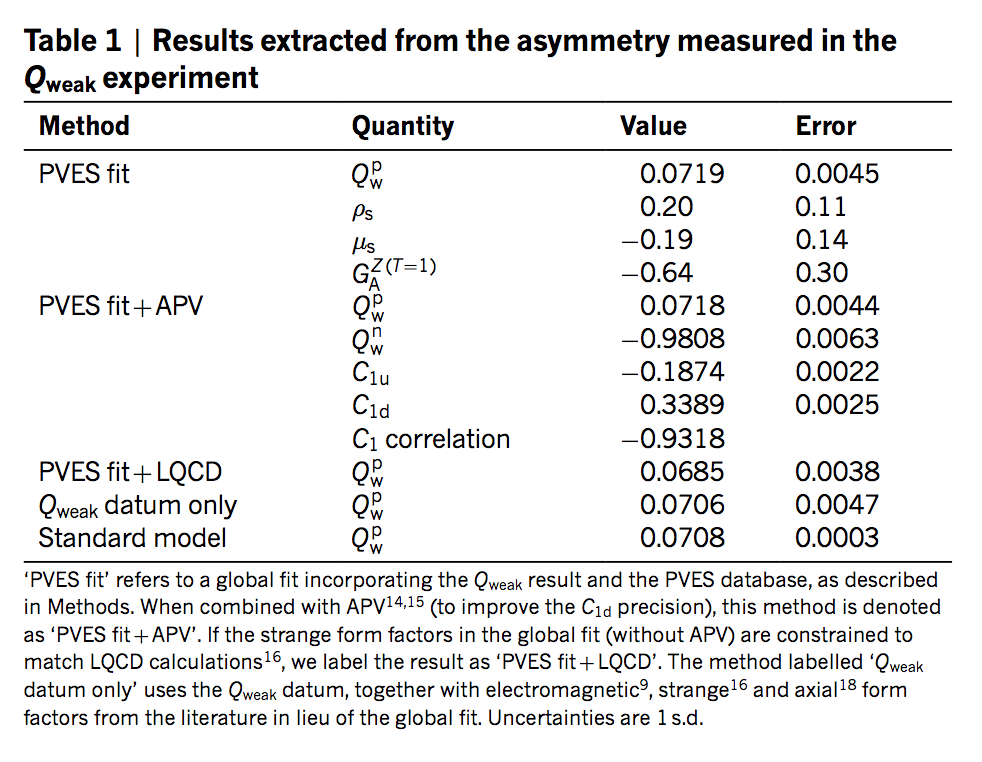
| From Nature: measurement of the weak charge of the proton. DOI: 10.1038/s41586-018-0096-0 The Jefferson Lab Qweak CollaborationNature, 2018, 557, pp 207 |
 |
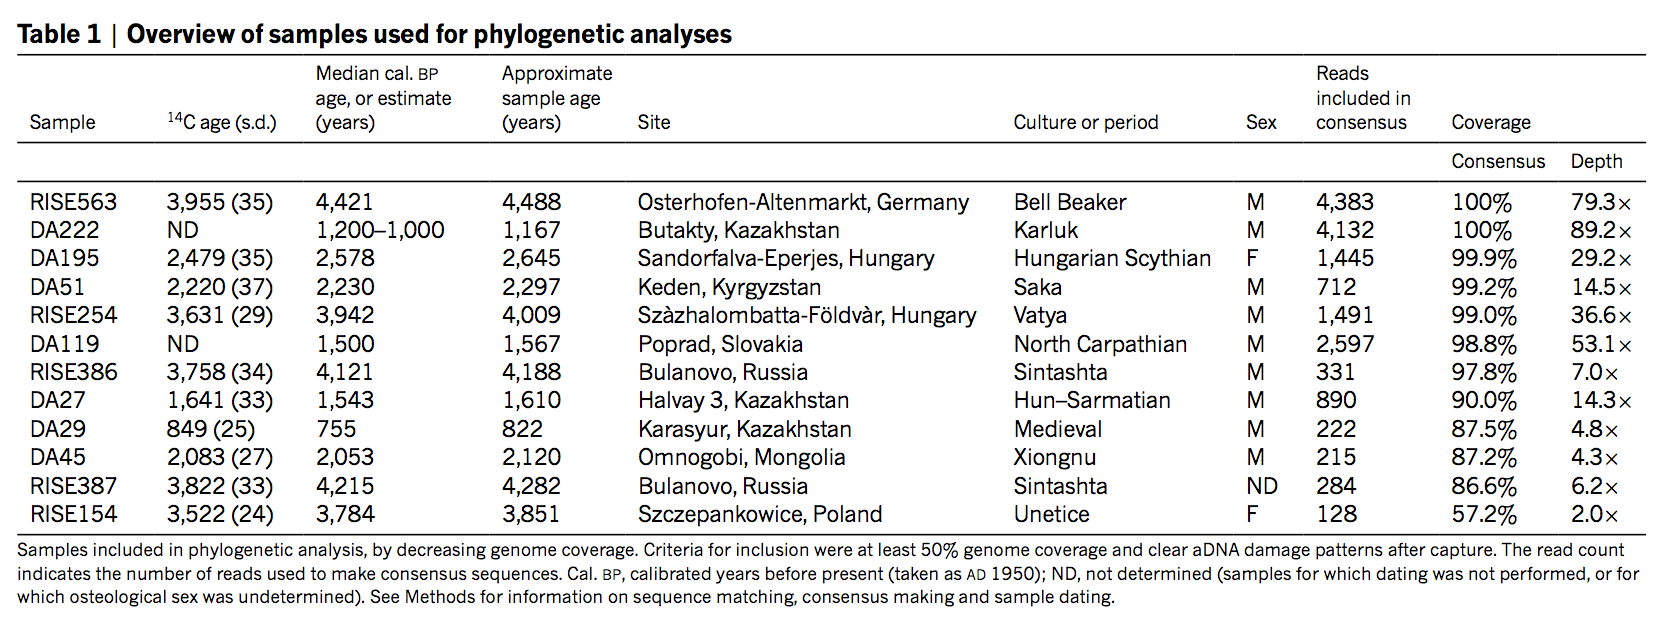
| A medical paper on hepatitis B published in Nature. DOI: 10.1038/s41586-018-0097-z Muhlemann, B.; et al.Nature, 2018, 557, pp 418–423 |
 |